Updated On: May 6, 2026
STM32 FreeRTOS Stack Management: Monitor Usage, High Water Mark & Overflow Detection
Stack memory management is one of the most critical aspects of developing embedded systems with FreeRTOS. Every task you create in your FreeRTOS system gets its own dedicated stack. When a task uses more stack memory than allocated, the excess data overflows into adjacent memory areas. This causes data corruption and unpredictable system crashes.
In this tutorial, we will see how to monitor stack usage effectively. We will use practical examples with STM32 microcontrollers and FreeRTOS. You will learn how to create a monitor task that tracks stack usage of all your other tasks. We will also enable stack overflow detection and implement a hook function that catches overflow events automatically.
This is the Part 8 of the STM32 CMSIS-RTOS FreeRTOS series. You can go through the other parts of this series, here are the links:
- Part 1 — Configure CMSIS RTOS in STM32
- Part 2 — Creating Multiple Tasks and Priorities in CMSIS RTOS
- Part 3 — How to use Queues for inter-task communication
- Part 4 — Using Semaphores in CMSIS RTOS
- Part 5 — Using Mutexes in CMSIS RTOS
- Part 6 — Task Synchronization using Event Flags
- Part 7 — Software Timers in FreeRTOS
Table Of Contents
- Why Stack Management Matters in FreeRTOS
- FreeRTOS Stack Monitoring API
- STM32 FreeRTOS Stack Monitor — CubeMX Setup
- STM32 FreeRTOS Stack Monitor Task: Implementation
- Testing FreeRTOS Stack Usage: Printf & Array Impact
- STM32 FreeRTOS Stack Overflow Hook: CubeMX Setup
- STM32 FreeRTOS Stack Management — Frequently Asked Questions
Why Stack Management Matters in FreeRTOS
Stack memory is critical in FreeRTOS systems. Every task you create gets its own dedicated stack space. When a task uses more memory than allocated, it creates serious problems. Understanding stack management helps you build reliable embedded systems that do not crash unexpectedly.
Understanding Stack Overflow Problems
A stack is a memory region where a task stores temporary data. This includes local variables, function parameters, and return addresses. The stack grows downward as a task executes more functions. When you allocate stack size during task creation, you set a maximum limit for that task’s stack memory.
Stack overflow happens when a task uses more memory than its allocated stack size. The excess data spills into adjacent memory areas. This corrupts data that belongs to other tasks or system components. The system then behaves unpredictably or crashes completely.
Here is what makes stack overflow particularly dangerous:
- Stack overflows do not always cause immediate crashes. Instead, they silently corrupt data in nearby memory. The system continues running until the corrupted data is actually accessed by the processor. This unpredictable behavior makes stack overflows extremely difficult to find and fix during development and testing.
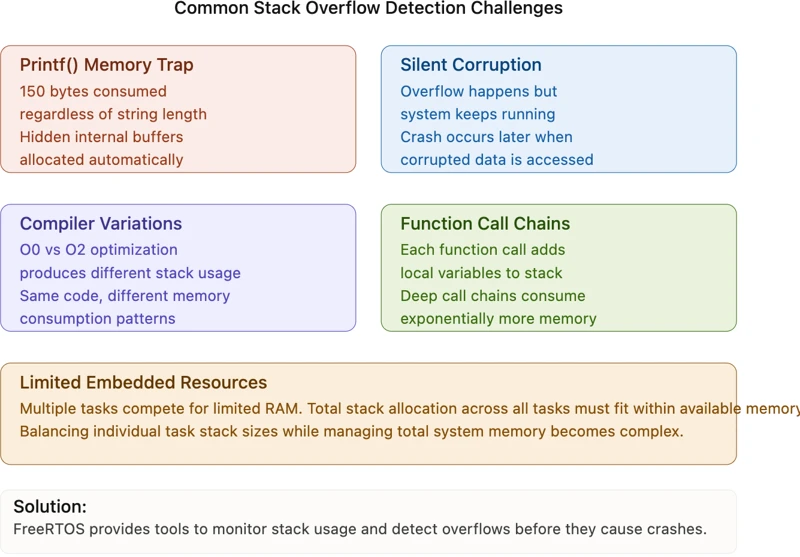
Common Issues with Stack Overflow Detection
Several common issues make stack overflow detection challenging.
- Unexpected memory consumption: Functions like
printf()consume far more stack space than developers expect. A singleprintf()call can use around 150 bytes of stack for internal buffers. This happens regardless of how short your text string is. The function reserves buffers in advance, not based on the actual string length.
- Silent failures: Unlike other programming errors, stack overflow does not trigger immediate exceptions. The overflow might happen, but your code keeps running. It only crashes when the corrupted memory gets accessed. By then, you have lost the connection between the overflow event and the crash.
- Compiler optimizations: Different compiler optimizations affect stack usage differently. Code compiled with optimization level O2 uses different amounts of stack than the same code compiled with O0. This makes it difficult to estimate stack sizes during initial development.
- Function call chains: When function A calls function B, which calls function C, the stack grows with each call. All local variables and parameters from all three functions occupy stack space simultaneously. Long function call chains can consume unexpected amounts of stack memory.
- Multiple tasks with limited memory: Embedded systems often have limited RAM. When you create multiple tasks, you must allocate stack space to each one. The total allocated stack across all tasks must fit within available RAM. Balancing individual task stack sizes while managing total system memory becomes complex.
FreeRTOS Stack Monitoring API
The FreeRTOS provides two essential functions to help you monitor stack usage. These functions give you visibility into how much memory your tasks are using. Understanding these tools is the first step toward preventing stack overflows.
Using osThreadGetStackSpace() Function
The osThreadGetStackSpace() function is your primary tool for monitoring stack usage during development and testing. This function retrieves information about how much free stack memory remains available in a task.
The function requires one parameter: the task handle. This is simply the identifier of the task you want to monitor. The function returns a 32-bit unsigned integer representing the number of free bytes currently available in the task’s stack.
Here is a simple example of calling this function:
uint32_t free_stack = osThreadGetStackSpace(task_handle);
printf("Free stack: %u bytes\n", free_stack);This small code tells you how much room is left in the task’s stack. If the value is very small, your task is using a lot of its allocated memory. If the value is large, your task has plenty of room to spare.
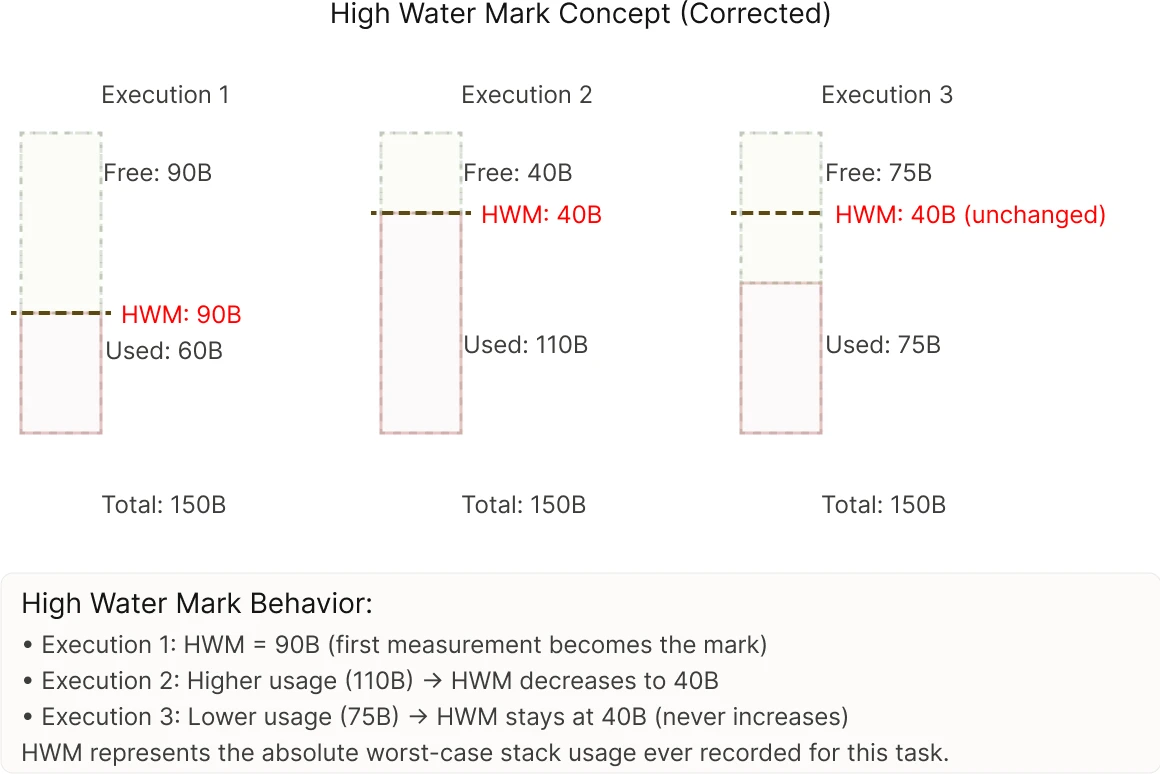
Measuring High Water Mark Values
The value that osThreadGetStackSpace() returns is called the high water mark. This term comes from observing water levels in a tank. The high water mark is the highest level the water ever reached. Similarly, the stack high water mark is the minimum amount of free stack space that has ever been recorded for that task.
Understanding high water mark values is crucial. It represents the worst-case scenario for stack usage. If a task’s high water mark is 100 bytes, it means the task has used at least 28 bytes of its allocated 128-byte stack at some point during execution.
Here is an example that demonstrates this concept:
Imagine a task with 256 bytes of allocated stack. During the first execution, the task uses 120 bytes, leaving 136 bytes free. This becomes the high water mark. Later, the task uses 150 bytes, leaving only 106 bytes free. The high water mark remains 106 bytes. The high water mark never increases. It only stays the same or decreases as the task executes more code paths and uses more memory.
This behavior is useful because it tells you the absolute minimum stack space that is safe for that task. Even if the task appears to be running fine right now, you know it once needed at least that much stack space. Therefore, you should allocate at least that amount to the task permanently.
The image below shows how high water mark tracking works:
STM32 FreeRTOS Stack Monitor — CubeMX Setup
Let us set up the project in CubeMX. We will configure the Tasks, UART, and GPIO for this project.
Creating the Tasks in CubeMX
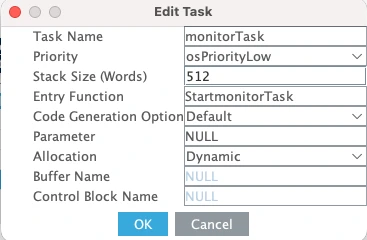
Go to the Tasks and Queues tab and add 3 regular tasks and one monitor task. The monitor task will monitor the stack usage of the regular tasks.
The images below shows the task configurations.
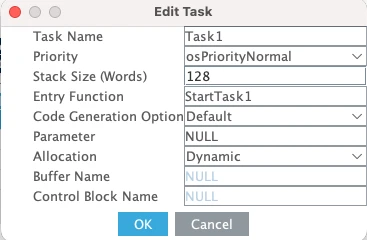
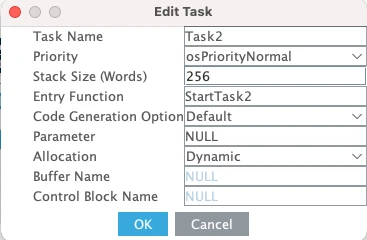

Here Task1, Task2 and Task3 have the Normal Priorities while their stack sizes differs. This is intentional, as we will see how much free stack is available in each case.
monitorTask has the lowest priority. It is kept to low so it does not preempt other tasks while they are running.
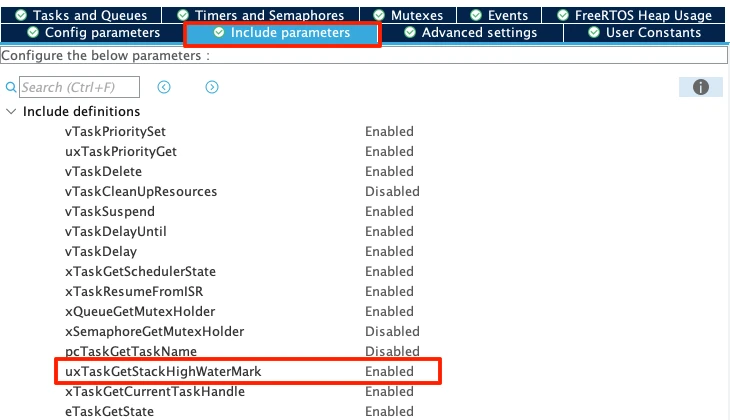
The parameter uxTaskGetStackHighWaterMark is already enabled by default. This parameter is needed for the stack monitoring to work, so confirm if this parameter is enabled.
Configuring LPUART1 for printf Output
We will use printf to print the received data to a serial console. On the STM32L496 Nucleo board, the Virtual COM port routes UART data through the ST-LINK USB connection. Looking at the board schematic, ST-LINK RX is connected to LPUART1 TX and ST-LINK TX is connected to LPUART1 RX. These map to pins PG7 and PG8.
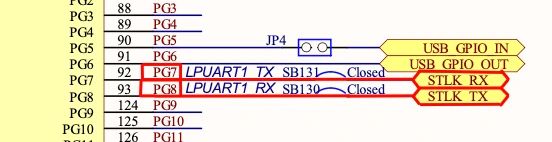
Go to Connectivity and enable LPUART1 in Asynchronous mode. By default, CubeMX assigns pins PC0 and PC1, so change these to PG7 (TX) and PG8 (RX).
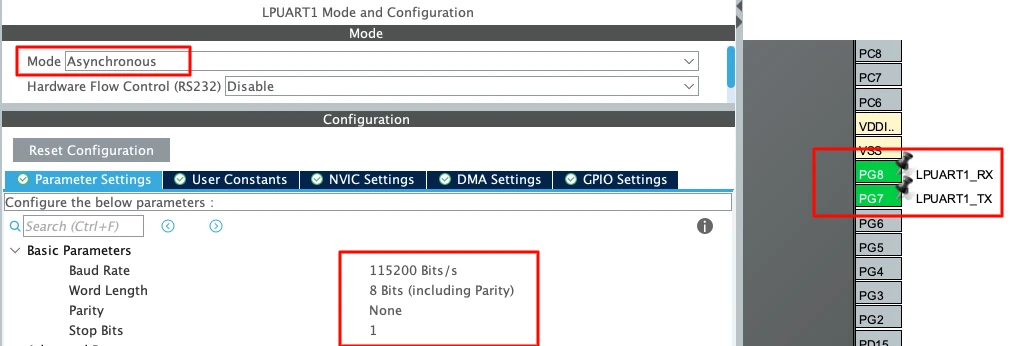
Use the following settings:
| Parameter | Value |
|---|---|
| Baud Rate | 115200 |
| Word Length | 8 bits |
| Parity | None |
| Stop Bits | 1 |
This is the standard UART configuration and matches what we will set in the serial console later.
Changing HAL Time Base from SysTick to TIM6
This step is very important in STM32 FreeRTOS projects. By default, STM32 uses SysTick as the HAL time base. But FreeRTOS also uses SysTick for its scheduler.
If both HAL and FreeRTOS share SysTick, it may create timing conflicts.
So we should dedicate:
- SysTick → FreeRTOS Scheduler
- TIM6 (or TIM7) → HAL Time Base
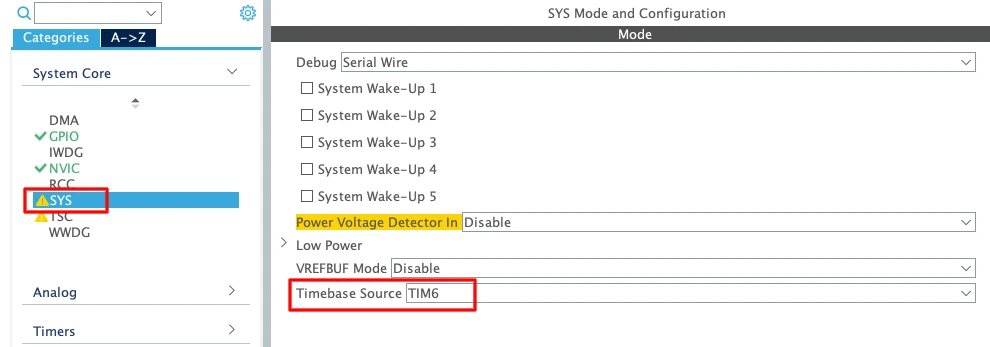
- Go to System Core → SYS
- Change Timebase Source from SysTick to TIM6 (or TIM7)
TIM6 and TIM7 are basic timers. They do not support PWM or advanced features. That is why they are ideal for this purpose.
Enabling Newlib Reentrant Support
Go to Middleware → FreeRTOS → Advanced Settings and Enable Use newlib reentrant.
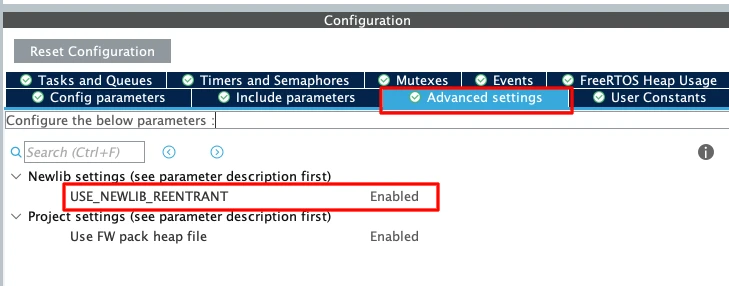
In an RTOS environment, multiple tasks may call functions like printf(); sprintf(); malloc(); etc. These standard C library functions are not thread-safe by default.
If two tasks call printf() at the same time, the output may get corrupted. Enabling newlib reentrant makes these functions safe in multitasking systems. It uses slightly more memory, but it prevents difficult debugging issues later.
STM32 FreeRTOS Stack Monitor Task: Implementation
A monitor task is a dedicated FreeRTOS task that continuously observes the stack usage of other tasks without interfering with them.
Retrieving Stack Information from Tasks
We will Use osThreadGetStackSpace() to read the free stack space from each task. The function requires a task handle as parameter:
uint32_t task1Stack = osThreadGetStackSpace(Task1Handle);
uint32_t task2Stack = osThreadGetStackSpace(Task2Handle);
uint32_t task3Stack = osThreadGetStackSpace(Task3Handle);Printing Stack Data to Serial Console
After measuring the task space, we will print it to the serial console using printf():
printf("Stack Free - Task1: %lu Bytes\t Task2: %lu Bytes\t Task3: %lu Bytes\n",
task1Stack, task2Stack, task3Stack);Complete Monitor Task Implementation
Here is the complete monitor task code:
void StartmonitorTask(void *argument)
{
uint32_t task1Stack, task2Stack, task3Stack;
for(;;)
{
osDelay(5000); // Wait 5 seconds between measurements
task1Stack = osThreadGetStackSpace(Task1Handle);
task2Stack = osThreadGetStackSpace(Task2Handle);
task3Stack = osThreadGetStackSpace(Task3Handle);
printf("Stack Free - Task1: %lu Bytes\t Task2: %lu Bytes\t Task3: %lu Bytes\n",
       task1Stack, task2Stack, task3Stack);
}
}The monitor task runs continuously. Every 5 seconds it reads the free stack from all three tasks and prints the values. The application tasks (Task1, Task2, Task3) remain empty at this stage. This shows the baseline stack usage when tasks contain no code.
When you run this code with empty tasks, the serial console displays the following:
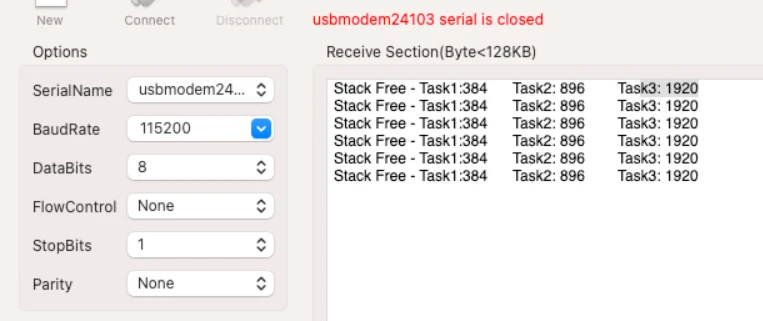
These values are the highest possible stack available because the tasks contain no code. As we add code to the tasks, these numbers will decrease, showing exactly how much stack the new code consumes.
Testing FreeRTOS Stack Usage: Printf & Array Impact
Measuring Printf Stack Consumption
Now add a printf() call to Task1 to see how much stack it consumes:
void StartTask1(void *argument)
{
  for(;;)
  {
	  printf ("Hello from Task 1\n");
    osDelay(2000);
  }
}Now run the monitor task and observe the output:
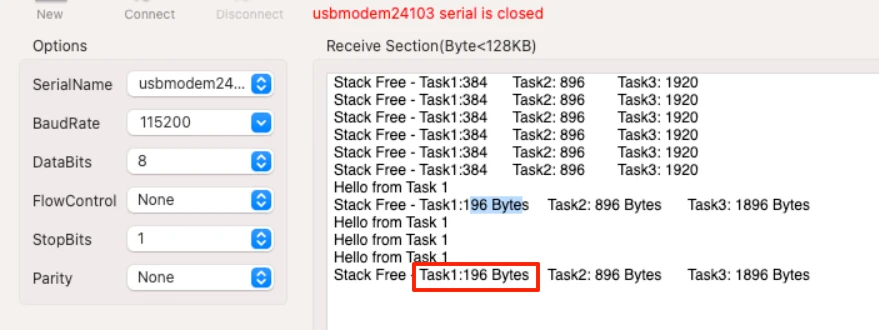
Task1’s free stack dropped from 384 bytes to 196 bytes. This means printf() consumed approximately 188 bytes in Task1’s context. Task2 and Task3 remain unchanged because they contain no code.
The string length does not matter. A single character print uses the same stack space as a long string because printf() reserves internal buffers in advance.
Testing with Local Arrays
Now add a local array of 100 bytes to Task1:
void StartTask1(void *argument)
{
  uint8_t foo[100];

  for(;;)
  {
	  printf ("Hello from Task 1\n");
    osDelay(2000);
  }
}The image below shows the output on the serial console:
![Serial console showing Task1 free stack at 92 bytes after adding uint8_t foo[100] — approximately 104 bytes consumed (100 bytes array plus 4 bytes compiler alignment overhead)](https://controllerstech.com/wp-content/uploads/2026/04/stm32_cmsis_rtos_8_10.webp)
Free stack dropped from 196 bytes to 92 bytes. The array consumed approximately 104 bytes (100 bytes for the array plus 4 bytes of compiler overhead for alignment and function frame setup).
Understanding Stack Overflow Silent Failures
Now increase the array size to 200 bytes:
void StartTask1(void *argument)
{
  uint8_t foo[200];

  for(;;)
  {
	  printf ("Hello from Task 1\n");
    osDelay(2000);
  }
}The image below shows the output on the serial console:
![Serial console showing Task1 free stack reads 0 bytes after uint8_t foo[200] causes stack overflow — Task1 continues running silently while memory adjacent to its stack is corrupted](https://controllerstech.com/wp-content/uploads/2026/04/stm32_cmsis_rtos_8_11.webp)
The monitor shows 0 bytes free. This indicates a serious stack overflow. However, Task1 continues running. The task does not crash immediately.
This is the dangerous nature of stack overflow. The overflow happens, but the corrupted memory area is not accessed yet. The task keeps executing. The system crashes later when the corrupted data is actually used. This unpredictable behavior makes stack overflow extremely difficult to find.
The solution is early detection. Monitor your stack usage during development. When you see free stack approaching zero, increase the task’s allocated stack size immediately. Do not wait for crashes to happen.
STM32 FreeRTOS Stack Overflow Hook: CubeMX Setup
The stack overflow detection is not enabled by default. We need to first enable it ourselves in the STM32CubeMX.
Enabling Stack Overflow Hook in CubeMX
Go to Middleware > FreeRTOS > Config Parameters and find the section Hook Function Related Definitions. Look for the parameter Check for Stack Overflow Hook. By default, it is disabled.
Enable it and select Option 2 from the dropdown. This activates automatic stack overflow detection.
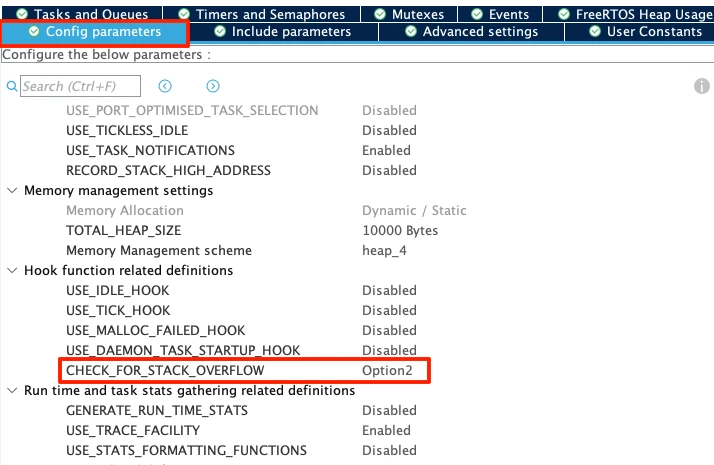
When enabled, a function called vApplicationStackOverflowHook is automatically generated in the FreeRTOS.c file. We need to write the implementation code inside this function to handle overflow events.
Option 1 vs Option 2 Detection Methods
FreeRTOS provides two detection methods:
Option 1: Checks if the stack pointer has gone out of bounds at every task context switch. This method is faster but may miss overflows that happen between context switches.
Option 2: Uses a pattern or marker value placed at the end of the stack to detect overflows more reliably. This method catches more overflow events because it checks continuously, not just during context switches. Option 2 uses slightly more processing power but provides better detection accuracy.
For most projects, Option 2 is recommended because it catches stack overflows more reliably.
Creating vApplicationStackOverflowHook Function
After enabling the hook in CubeMX and regenerating the code, open the FreeRTOS.c file. Find the vApplicationStackOverflowHook function:
void vApplicationStackOverflowHook(xTaskHandle xTask, signed char *pcTaskName)
{
    // Add your overflow handling code here
}This function receives two parameters:
xTask: The handle of the task that overflowedpcTaskName: The name of the task as a string
Add an infinite loop to stop execution when overflow is detected:
void vApplicationStackOverflowHook(xTaskHandle xTask, signed char *pcTaskName)
{
    while(1)
    {

    }
}When a stack overflow occurs, this infinite loop prevents the system from continuing. This stops further corruption and prevents unpredictable behavior.
To log which task caused the overflow, use direct UART transmission (not printf(), as it may fail in this critical context):
extern UART_HandleTypeDef hlpuart1;

void vApplicationStackOverflowHook(xTaskHandle xTask, signed char *pcTaskName)
{
    // Re-initialize UART to ensure it works
    HAL_UART_DeInit(&hlpuart1);
    HAL_UART_Init(&hlpuart1);

	  char msg[100];
	  int len = sprintf (msg, "Stack Overflow Detected in: %s\n", pcTaskName);
	  HAL_UART_Transmit(&hlpuart1, (uint8_t *)msg, len, 1000);

    // Stop execution
    while(1);
}When a stack overflow occurs, the hook function prints the task name to the serial console, then enters an infinite loop. The system halts, preventing further corruption. You see the error message on your serial terminal and know exactly which task caused the problem.
Output
When a stack overflow is detected, the serial console displays the error message:
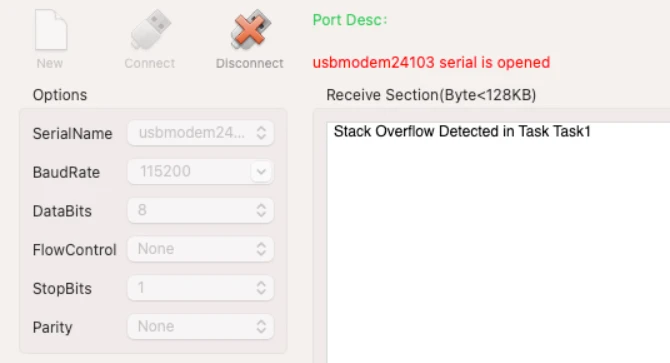
At this point, the system stops executing all tasks. The infinite loop in the hook function prevents any further code execution.
How to fix it:
Reduce the stack overflow-causing code or increase Task1’s allocated stack size in CubeMX. Regenerate the code, rebuild the project, and flash it again. The system should now run without triggering the overflow hook.
STM32 FreeRTOS Stack Management Tutorial — Video Walkthrough
This video covers the complete FreeRTOS stack management workflow on STM32: stack overflow causes and silent failure behaviour, osThreadGetStackSpace() and high water mark explained, CubeMX setup for four tasks and LPUART1, complete monitor task implementation, three progressive stack consumption tests (empty tasks, printf(), 100-byte array, 200-byte array overflow), and vApplicationStackOverflowHook() implementation with UART diagnostic output — all on the STM32 Nucleo-L496ZG-P.
STM32 FreeRTOS Stack Management — Frequently Asked Questions
Conclusion
Stack overflow is the most common cause of silent, hard-to-reproduce crashes in FreeRTOS applications. The problem is not just that overflow happens — it is that the system keeps running after it happens, corrupting memory that belongs to a completely different part of the code, and crashing somewhere that has nothing to do with the overflow itself. By the time the debugger breaks, the evidence is gone.
In this tutorial you built the complete defence against this: a monitor task that calls osThreadGetStackSpace() every five seconds and logs the high water mark for every task in your system. You saw exactly how much stack printf() consumes (approximately 188 bytes regardless of string length), how a 100-byte local array adds 104 bytes of stack overhead with alignment, and how a 200-byte array overflows the task entirely while the monitor still reads zero and the task keeps running — proof that your eyes alone cannot catch this during development.
The overflow hook vApplicationStackOverflowHook() closes the gap. With Option 2 enabled in CubeMX, the FreeRTOS kernel writes a known pattern to the bottom of every task's stack and checks it on every context switch. When the pattern is corrupted, the hook fires immediately — before the corrupted memory reaches production code — and your UART prints the exact task name that caused the problem.
The rule from this tutorial applies permanently: during development, run your monitor task, observe the high water marks under worst-case load, and add at least 20–30% headroom above the lowest observed free value when you set your final stack sizes. Never ship firmware with a task that has read zero free stack in testing.
This is the final part of the core STM32 CMSIS-RTOS series. You now have the full toolkit: task creation and preemption from Part 2, inter-task data transfer from Part 3 — Queues, synchronisation from Part 4 — Semaphores and Part 5 — Mutexes, event-driven wake-up from Part 6 — Event Flags, background scheduling from Part 7 — Software Timers, and now the production safety net of stack monitoring and overflow detection. Browse the full STM32 FreeRTOS tutorial series for all parts.
Download STM32 FreeRTOS Stack Management Project Files
Complete STM32CubeIDE project for the STM32 Nucleo-L496ZG-P with four CMSIS-OS V2 tasks: Task1 (128-word stack), Task2 (256-word stack), Task3 (512-word stack), and monitorTask (Low priority, reports free stack every 5 seconds via osThreadGetStackSpace()). Includes three progressive test variants (empty, printf(), 100-byte array, 200-byte overflow), vApplicationStackOverflowHook() with UART diagnostic output, LPUART1 at 115200 baud, HAL time base on TIM6, and newlib reentrant enabled. Free to download — support the work if it helped you.
Browse More STM32 FreeRTOS Tutorials
STM32 FreeRTOS Multiple Tasks, Priorities & Preemption — CMSIS-RTOS V2 Guide
STM32 FreeRTOS Queue Tutorial: Inter-Task Communication with CMSIS-OS V2
STM32 FreeRTOS Semaphores: How to Use Binary and Counting Semaphores
STM32 FreeRTOS Mutex: Priority Inheritance & Recursive Mutex
STM32 FreeRTOS Event Flags: osFlagsWaitAll, WaitAny & ISR Callbacks

Subscribe
Login
0 Comments
Newest
