
Updated On: April 17, 2026
STM32 Real-Time Graph using Mongoose Ethernet
In this tutorial, we will use the real-time graph feature of the Mongoose Networking library to display live sensor and ADC data on a web UI dashboard. This feature was recently added to Mongoose, and it makes it very easy to visualize time-varying data directly in a browser.
We will create three real-time graphs — one for temperature, one for humidity (both from the SHT21 sensor), and one for ADC data from a potentiometer. The graphs update automatically over WebSocket without any page refresh.
This is Part 5 of the STM32 TCP/IP with Mongoose series. The earlier parts are listed below:
- STM32 TCP/IP with Mongoose: Complete Setup Guide
- STM32 HTTP Webserver using Mongoose
- STM32 Weather Station using Mongoose
- STM32 OTA Firmware Update using Mongoose
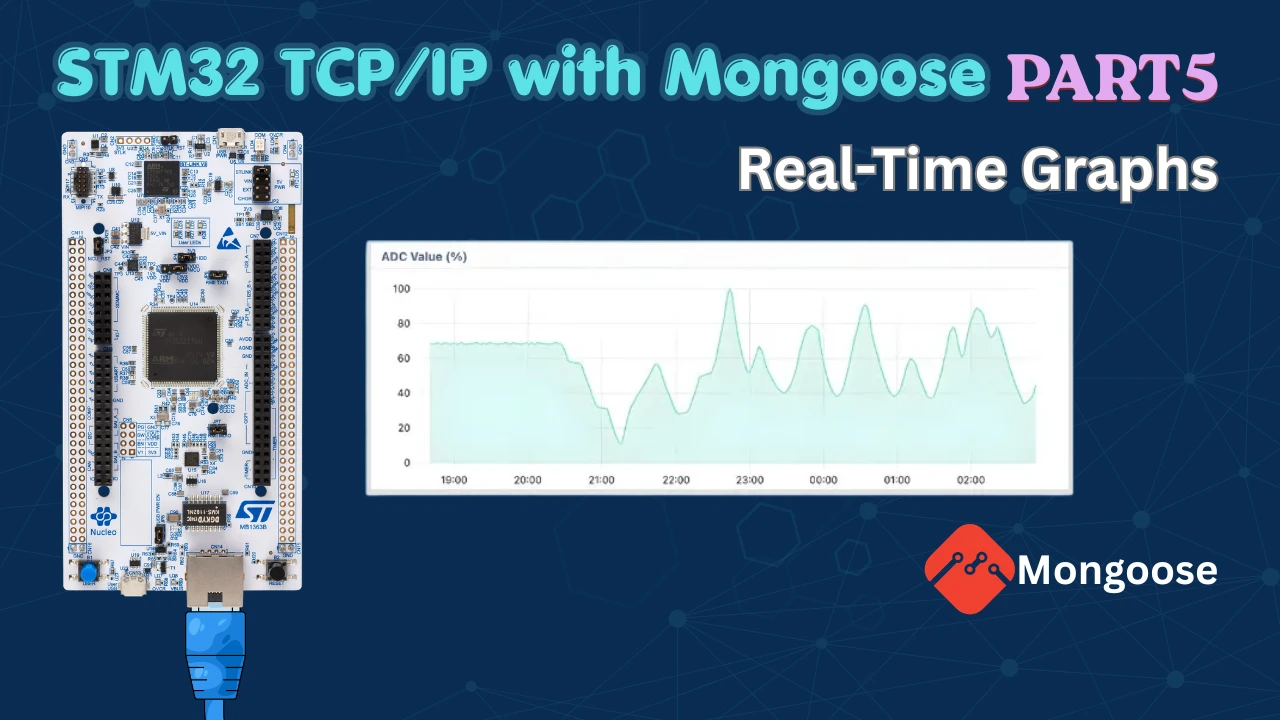
Table Of Contents
- What is Mongoose Real-Time Graph?
- STM32 Real-Time Graph – Hardware Setup
- Mongoose Dashboard – Graph Configuration
- STM32 CubeMX – I2C and ADC Setup
- STM32 Real-Time Graph – Code
- STM32 Real-Time Graph – Result
- STM32 Real-Time Graph using Mongoose — Video Tutorial
- Download STM32 Real-Time Graph (Mongoose) Project Files
- STM32 Real-Time Graph using Mongoose — Frequently Asked Questions
What is Mongoose Real-Time Graph?
The real-time graph is a built-in UI element in the Mongoose dashboard wizard. It displays live, continuously changing data over a selected time window directly on the web UI. The graph scrolls automatically as new data arrives — you do not need to write any frontend code.
The graph has three key parameters you can configure:
- xrange — the time window shown on the X-axis (in seconds)
- updateMs — how often the graph refreshes (in milliseconds)
- scale — the Y-axis min and max range; values outside this are ignored
These are set per graph, so each graph on your dashboard can have a completely different update rate and time window.
What Data Can You Display?
This graph works well for any time-varying data coming from the microcontroller. Some common use cases include:
- Temperature and humidity from sensors
- ADC readings from potentiometers or other analog inputs
- CPU or memory usage
- Voltage, current, or power values
- Network packet counters
In this tutorial, we are displaying temperature, humidity, and ADC data.
How the Graph Gets Updated (WebSocket)
The graph uses WebSocket to receive data from the STM32. Mongoose has a built-in WebSocket reporter that calls a getter function at a defined interval and pushes the data to the browser. We register this reporter in our code using mongoose_add_ws_reporter, and the graph updates automatically.
This is different from a regular HTTP GET request. With WebSocket, the connection stays open and the STM32 pushes new data to the browser as soon as it is ready — without the browser having to ask for it each time. This is what makes the graph feel truly live.
STM32 Real-Time Graph – Hardware Setup
Hardware Used
I am using the STM32H745 Discovery board for this tutorial. The image below shows the wiring diagram for this project.

SHT21 Sensor (I2C)
The SHT21 communicates over I2C. We connect it to pins PD12 (SCL) and PD13 (SDA) on the STM32. These map to the I2C4 peripheral. The sensor is powered from the 3.3V pin and shares a common ground with the board.
Potentiometer (ADC)
The potentiometer is connected to pin PC0, which is the input for ADC1 Channel 10. The two outer legs of the potentiometer go to 3.3V and GND. The middle wiper leg connects to PC0. As you rotate the knob, the voltage on PC0 changes between 0 and 3.3V, and the ADC converts this into a 16-bit digital value.
What We Will Build
We will create a Mongoose dashboard with three real-time graphs — Temperature, Humidity, and ADC. The image below shows the final dashboard we are working towards.

Each graph will have its own time range and update interval:
- Temperature graph — updates every 1 second, shows the last 5 minutes, Y-axis from 0 to 60°C
- Humidity graph — updates every 1 second, shows the last 5 minutes, Y-axis from 0 to 100%
- ADC graph — updates every 100ms, shows the last 30 seconds, Y-axis from 0 to 100
On the STM32 side, we will interface the SHT21 sensor over I2C4 and read the potentiometer value using ADC1 in blocking mode. We will write a getter function for each data source, convert the raw ADC value to a 0–100 range, and register WebSocket reporters so Mongoose calls these functions automatically at the right interval and pushes the data to the browser.
The whole setup runs without any RTOS — just a bare-metal polling loop with mongoose_poll() driving everything.
Mongoose Dashboard – Graph Configuration
We start by creating a new C/C++ project in Mongoose Wizard. We select the STM32H745 Discovery board, set the build environment to CubeIDE, and keep the RTOS option as baremetal. We start with a completely blank dashboard.
Creating the Graph Container and Panels
First, go to the UI Element tab and add a container. Then add a panel inside that container. Inside the panel, delete everything except the title text and rename it to Temperature. Now add a graph element inside this panel.
Once the first panel is ready, duplicate the entire container two more times. Rename the second panel to Humidity and the third to ADC.

Creating the REST API Endpoints
Now go to the REST API section and create a new endpoint.
We will use a single endpoint for both temperature and humidity, since both values come from the same SHT21 sensor.

Set the endpoint type to data, which maps a C structure to the UI. Add two attributes — temp and hum — both of type double.
// Auto-generated structure (from Mongoose wizard)
struct sensor {
  double temp;
  double hum;
};Then create a second endpoint for ADC data. This one has a single attribute of type int.

// Auto-generated structure (from Mongoose wizard)
struct ADC {
  int value;
};Assigning API Variables to the Graphs
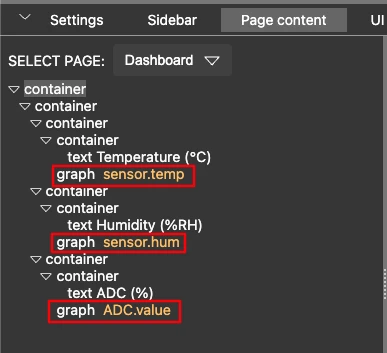
Go back to the Page Content section and assign the API variables to the three graph elements:
- Temperature graph →
sensor.temp - Humidity graph →
sensor.hum - ADC graph →
ADC.value
At this point, you can already see a preview of how the graphs will look on the dashboard.
Configuring Graph Options
Each graph has a Graph Options section that lets us control the time range, update interval, and Y-axis scale. If the options section does not appear, refresh the page once.
Here is what each parameter means:
- xrange — the time window in seconds shown on the X-axis
- updateMs — how often the graph refreshes, in milliseconds
- scale — the Y-axis range; values outside this range are ignored
For the Temperature graph, we want a 5-minute time window with 1-second updates and a range of 0–60°C:
{"xrange":300,"updateMs":1000,"uplot":{"scales":{"y":{"auto":false,"min":0,"max":60}}}}- “xrange”: 300
We set the X-axis range to 300 sec (5 min). The graph will display data for the last 5 minutes. - “updateMs”: 1000
The graph updates every 1000 ms (1 second). It fetches new data from the API at this interval. - “auto”: false
We disable automatic scaling of the Y-axis. - “min”: 0, “max”: 60
We manually set the Y-axis range from 0 to 60. This is useful for temperature data to keep the scale fixed.
This setup ensures the graph shows a fixed range with controlled updates, which makes the visualization stable and easy to read.
For the Humidity graph, the same time window and update interval work well. Since humidity is a percentage, we set the scale from 0 to 100:
{"xrange":300,"updateMs":1000,"uplot":{"scales":{"y":{"auto":false,"min":0,"max":100}}}}For the ADC graph, we use a 30-second window with updates every 100ms:
{"xrange":30,"updateMs":100,"uplot":{"scales":{"y":{"auto":false,"min":0,"max":100}}}}To apply the new graph options, paste the JSON into the Graph Options field for each graph. This forces the graph to reload and apply the new configuration.
Note:
WebSocket is not enabled by default in Mongoose. Make sure to enable it from the Settings section in the wizard before generating the project.
STM32 CubeMX – I2C and ADC Setup
After generating the project and importing it into STM32 CubeIDE, we need to configure the hardware pins. Since CubeIDE no longer includes CubeMX, we open it as a separate application and load the generated project into it.
Configuring I2C for SHT21
Search for pins PD12 and PD13 in CubeMX and configure them as I2C pins. These pins belong to I2C4, so enable I2C4 in the peripheral list. We keep the default settings — standard mode with a clock speed of 100 kHz.

Configuring ADC for the Potentiometer
Open ADC1 in CubeMX and enable Channel 10 in single-ended mode. Pin PC0 will automatically be assigned as the ADC input. We keep the default ADC settings. The default resolution is 16 bits, and we will read the ADC in blocking mode.

This is all the configuration required in the CubeMX.
STM32 Real-Time Graph – Code
Open the mongoose_glue.c file inside the Mongoose folder. This file contains auto-generated getter functions that are called periodically to send data to the web UI. We should not edit this file directly — it gets overwritten whenever we regenerate the dashboard.
Instead, we copy the relevant getter function signatures into main.c and write our own implementations there.
Adding the SHT21 Library
We need to add the SHT21 sensor library to the project. I have already covered a tutorial on how to interface SHT21 with STM32. Copy SHT21.c into the src directory and SHT21.h into the inc directory. Then include the header in main.c:
#include "SHT21.h"We also need to fix a few conflicts between the SHT21 library and the Mongoose-generated project:
- Remove the
writefunction fromSHT21.c— it is already defined in the Mongoose project - Remove the UART definition from
SHT21.c - Make sure the correct I2C instance (I2C4) is defined in the SHT21 library
Initialize the sensor inside main() before calling mongoose_init():
SHT21_Init(&hi2c4);Sensor Getter Function (Temperature & Humidity)
The getter function for the sensor reads the temperature and humidity from the SHT21 and stores them in the sensor structure. Mongoose calls this function periodically and sends the data to the graph.
void my_get_sensor(struct sensor *data)
{
	SHT21_ReadTemperature(&temperature);
	SHT21_ReadHumidity(&humidity);
	data->temp = temperature;
	data->hum = humidity;

	MG_INFO(("Temp: %.2f\t Hum: %.2f\n", data->temp, data->hum));
}MG_INFO prints the values to the serial console, which is useful for debugging.
ADC Getter Function
For the ADC, we first read the raw value and then convert it to a 0–100 range so it fits within the graph scale. We create a small map utility function for this:
long map(long x, long in_min, long in_max, long out_min, long out_max)
{
return (x - in_min) * (out_max - out_min + 1) / (in_max - in_min + 1) + out_min;
}
int readADC (void)
{
HAL_ADC_Start(&hadc1);
HAL_ADC_PollForConversion(&hadc1, 10);
uint16_t val = HAL_ADC_GetValue(&hadc1);
HAL_ADC_Stop(&hadc1);
return (map(val, 0, 65535, 0, 100));
}Then the getter function stores this converted value into the ADC structure:
void my_get_adc(struct adc *data)
{
data->value = readADC();
}Registering HTTP Handlers and WebSocket Reporters
At this point, Mongoose does not know about our custom functions yet. We need to register them using mongoose_set_http_handlers and add WebSocket reporters to call them at the correct intervals.
Add the following inside main() right after mongoose_init():
mongoose_set_http_handlers("sensor", my_get_sensor, NULL);
mongoose_add_ws_reporter(1000, "sensor");
mongoose_set_http_handlers("ADC", my_get_ADC, NULL);
mongoose_add_ws_reporter(100, "ADC");The first argument to mongoose_add_ws_reporter is the interval in milliseconds. The sensor reporter calls my_get_sensor every 1 second, and the ADC reporter calls my_get_adc every 100ms. These intervals match the updateMs values we set in the graph options.
The endpoint name passed to both functions must exactly match the endpoint name defined in the Mongoose wizard.
Full Code
Here is the complete code combining all the pieces we wrote in main.c:
#include "SHT21.h"
float temperature, humidity;
/* Map utility */
long map(long x, long in_min, long in_max, long out_min, long out_max)
{
return (x - in_min) * (out_max - out_min + 1) / (in_max - in_min + 1) + out_min;
}
/* Read ADC and convert to 0-100 */
int readADC (void)
{
HAL_ADC_Start(&hadc1);
HAL_ADC_PollForConversion(&hadc1, 10);
uint16_t val = HAL_ADC_GetValue(&hadc1);
HAL_ADC_Stop(&hadc1);
return (map(val, 0, 65535, 0, 100));
}
/* Sensor getter — called every 1 second by WebSocket reporter */
void my_get_sensor(struct sensor *data)
{
	SHT21_ReadTemperature(&temperature);
	SHT21_ReadHumidity(&humidity);
	data->temp = temperature;
	data->hum = humidity;

	MG_INFO(("Temp: %.2f\t Hum: %.2f\n", data->temp, data->hum));
}
/* ADC getter — called every 100ms by WebSocket reporter */
void my_get_ADC(struct ADC *data)
{
data->value = readADC();
}
/* Inside main() */
SHT21_Init(&hi2c4);
mongoose_init();
  mongoose_set_http_handlers("sensor", my_get_sensor, NULL);
  mongoose_add_ws_reporter(1000, "sensor");

  mongoose_set_http_handlers("ADC", my_get_ADC, NULL);
  mongoose_add_ws_reporter(100, "ADC");
for (;;) {
mongoose_poll();
}STM32 Real-Time Graph – Result
Serial Console
After flashing, open the serial console in STM32 CubeIDE. Mongoose will initialize and print the assigned IP address. Below that, you should see the temperature and humidity values printing every second.

Web UI Graphs
Open the IP address in a browser. The dashboard loads and all three graphs start updating.
The temperature and humidity graphs update every second. You can hover over the graph to see the exact value at any point in time. The X-axis shows UTC time.

The ADC graph updates every 100ms. When you rotate the potentiometer, the graph responds immediately, tracking the value in real time.

STM32 Real-Time Graph using Mongoose — Video Tutorial
This video walks through the complete implementation of real-time graphs on STM32 using the Mongoose Ethernet library. We configure three live graphs for temperature, humidity, and ADC data, interface the SHT21 sensor over I2C, and push data over WebSocket to a web UI dashboard running in the browser.
Download STM32 Real-Time Graph (Mongoose) Project Files
Complete CubeIDE project with Mongoose configuration, SHT21 library, ADC code, and web UI for all three real-time graphs. Free to download — support the work if it helped you.
STM32 Real-Time Graph using Mongoose — Frequently Asked Questions
Conclusion
In this tutorial, we used the Mongoose real-time graph feature to display live temperature, humidity, and ADC data on a web UI dashboard running on STM32. We configured three graphs using the Mongoose Wizard, set up the SHT21 sensor over I2C and a potentiometer on ADC1, wrote custom getter functions in main.c, and registered WebSocket reporters to push data to the browser at defined intervals.
This kind of live data visualization is genuinely useful in embedded projects. Instead of reading raw values off a serial console, you get a scrolling graph in a browser that lets you spot trends, catch anomalies, and debug sensors in real time. You can extend this same approach to plot heart rate, ECG waveforms, accelerometer data, battery voltage, or any other time-varying signal — all without writing a single line of frontend code.
Browse More STM32 Mongoose TCP/IP Tutorials

STM32 Web Server using Mongoose: HTTP, WebSocket & ADC Dashboard
STM32 Weather Station Web Server using Mongoose (Ethernet + BME280)

STM32 OTA Firmware Update using Mongoose – Step by Step Guide

STM32 Fixed Memory Pool for Networking using Mongoose and O1heap
STM32 Mongoose with W5500 – Ethernet on Any STM32 MCU

STM32 Modbus TCP Server – Read Input Registers with Mongoose

STM32 Modbus TCP Server – Read Discrete Inputs with Mongoose

Subscribe
Login
0 Comments
Newest
