
Updated On: April 17, 2026
STM32 Weather Station using Mongoose Web Server (Ethernet + BME280)
In this tutorial, we will build a complete STM32 Ethernet Weather Station using the Mongoose Web Server. The system will read environmental data from the BME280 sensor and display it on a dynamic web interface.
We will measure temperature, humidity, and pressure at regular intervals and serve this data over Ethernet. The web UI will show live values using gauges and historical data using graphs.
This project uses the Mongoose networking library, which allows us to implement a lightweight web server directly on the STM32. With this approach, we do not need any external server or cloud platform.
We will use a timer interrupt to read sensor data every 5 seconds. The readings will be stored and processed to generate averages every 1 hour. These values will then be displayed on graphs using REST APIs. For real-time updates, we will use WebSocket communication. This will allow the gauges and graphs to update instantly without refreshing the page.
This tutorial is Part 3 of the STM32 TCP/IP with Mongoose series. I have also covered several other tutorials based on the which demonstrate different features such as HTTP server, WebSocket communication, and embedded web UI.
You can explore them below:
- STM32 TCP/IP with Mongoose: Complete Setup Guide
- STM32 HTTP Webserver using Mongoose
- STM32 OTA Firmware Update using Mongoose
Table Of Contents
- STM32 Ethernet Weather Station: How It Works
- STM32 Weather Station Web UI: Gauges, Graphs & WebSocket
- CubeMX Setup: I2C for BME280 and Timer Interrupt
- Reading BME280 Data with STM32 Timer Interrupt
- STM32 Weather Station: Getter Functions & WebSocket Reporters
- STM32 Mongoose Weather Station: Live Dashboard Output
- STM32 Weather Station using Mongoose — Video Tutorial
- Download STM32 Weather Station with Mongoose Project Files
- STM32 Mongoose Weather Station — Frequently Asked Questions
STM32 Ethernet Weather Station: How It Works
In this project, we build a web-based weather station using STM32. The system reads environmental data from the BME280 sensor and serves it over Ethernet using the Mongoose web server.
We measure three parameters:
- Temperature
- Humidity
- Pressure
The STM32 processes this data and hosts a web interface. This interface shows:
- Live values using gauges
- Historical data using graphs
We use WebSocket to update the gauges and graphs in real time. The entire system runs on the STM32. No external server is required.
Required Components
To build this project, we need the following hardware:
- STM32 microcontroller with Ethernet support (F7 / H7 recommended)
- BME280 Temperature, Humidity, Pressure sensor
- Ethernet PHY (if not onboard)
- Router (required for network and SNTP time sync)
- Connecting wires
We also need the following software:
- STM32CubeIDE / CubeMX
- Mongoose Networking Library
- BME280 driver
STM32 Weather Station Web UI: Gauges, Graphs & WebSocket
In this section, we will configure the web UI for the STM32 Mongoose web server. The UI will display live sensor values using gauges and historical data using graphs. We will also enable WebSocket and required settings for real-time updates.
I have already covered how to configure Web UI using mongoose wizard in the previous tutorial, so here we will just cover the elements related to this tutorial only.
Gauge Configuration (Temperature, Humidity, Pressure)
We will create three gauges to display the current sensor values:
- Temperature
- Humidity
- Pressure
The image below shows the 3 gauges on the Web UI.
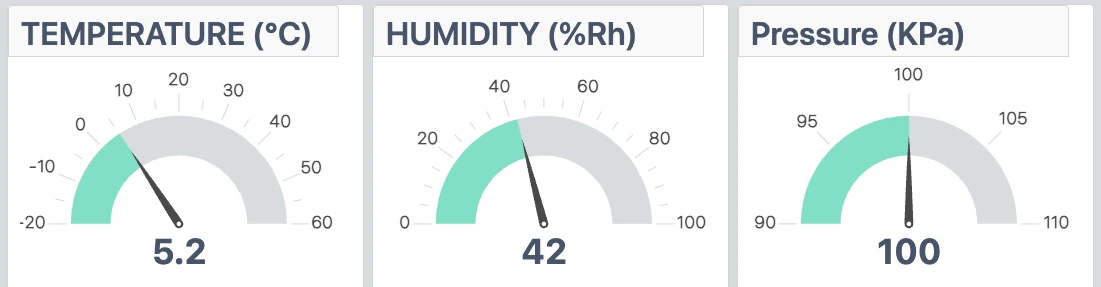
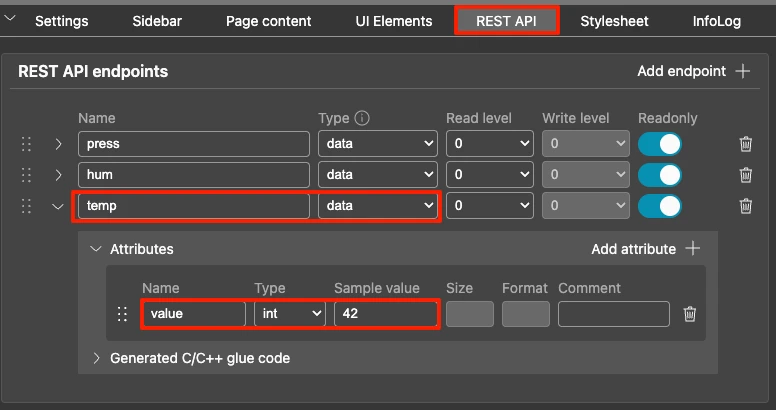
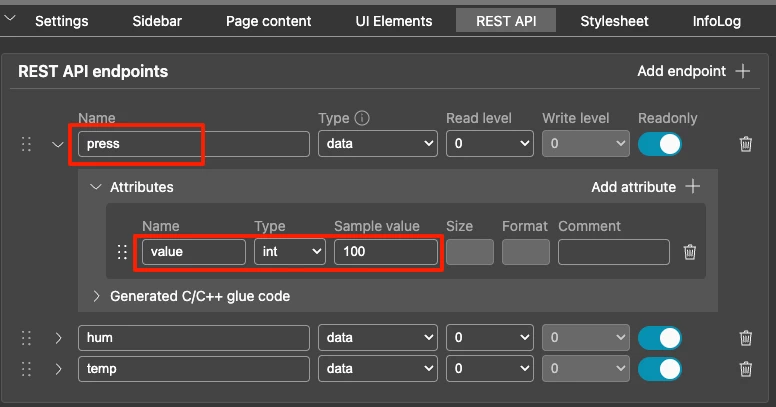
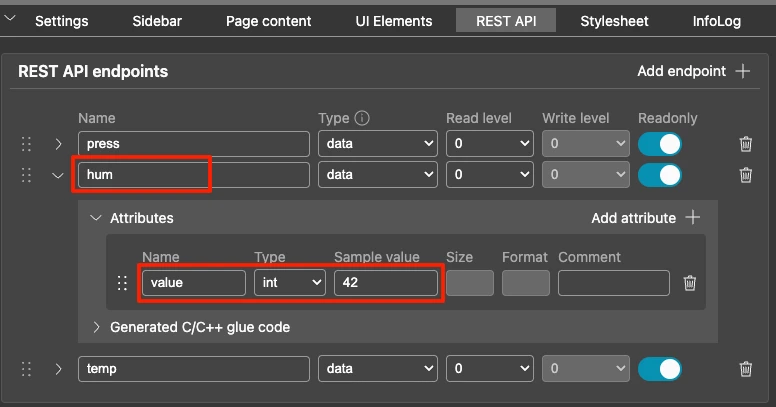
For each gauge, we need to create REST API. The values will be updated using the Websocket periodically. The images below shows the REST API for all three gauges.
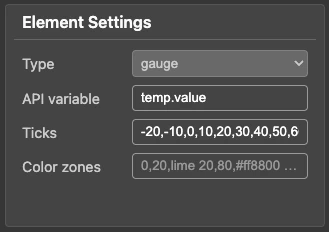
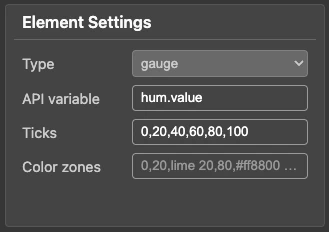
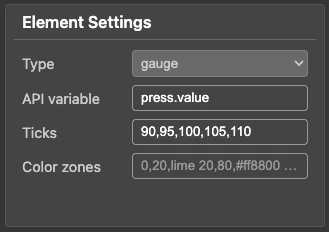
We should also define the range (ticks) for each gauge. This helps in properly visualizing the values.
For example:
- Temperature → -20 to 60 ℃
- Humidity → 0 to 100 %Rh
- Pressure → 90 to 110 KPa
The images below shows the ticks defined for all three gauges.
Graph API Configuration
Next, we configure graphs to display data over time. The graph can also be linked to the same API Endpoint, which the gauge uses. This way we do not need to handle the gauge and graph separately for each field.
The images below shows the Element configurations. Note that the gauge and respective graph uses the same endpoints.
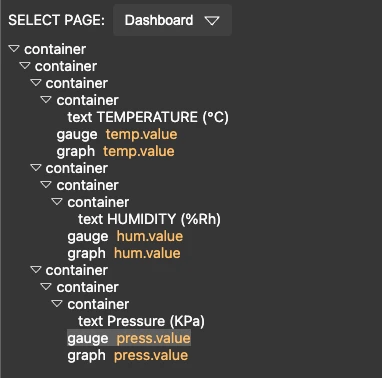
Just like ticks in the gauges, we have Graph Options in graphs. Here we can configure the graph horizontal and vertical ranges, as well as the graph update interval. For example, in this tutorial I have used the following options:
{"xrange":86400,"updateMs":30000,"uplot":{"scales":{"y":{"auto":false,"min":-20,"max":60}}}}- “xrange”: 86400
We set the X-axis range to 86400 sec (24 hours). The graph will display data for the last 24 hours. - “updateMs”: 30000
The graph updates every 30000 ms (30 seconds). It fetches new data from the API at this interval. - “auto”: false
We disable automatic scaling of the Y-axis. - “min”: -20, “max”: 60
We manually set the Y-axis range from -20 to 60. This is useful for temperature data to keep the scale fixed.
This setup ensures the graph shows a fixed range with controlled updates, which makes the visualization stable and easy to read.
WebSocket and Settings Configuration
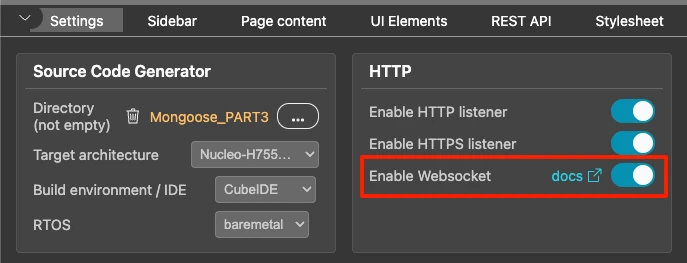
To update the gauges in real time, we enable WebSocket in the UI settings. Later in the code, we will use the Websocket to send data every 30 seconds.
The image below shows the Websocket configuration in the mongoose Web UI dashboard settings page.
CubeMX Setup: I2C for BME280 and Timer Interrupt
Now that we have configured the WebUI and generated the project, the next step is to configure the STM32 CubeMX. Here we will configure the I2C peripheral for the BME280 sensor and the timer for generating an interrupt at a fixed interval.
Timer Configuration (5 Second Sampling)
We will use the Timer to generate an interrupt every 5 seconds. This interrupt will be then used to measure the temperature, humidity and pressure data from the sensor. Below is the image showing the TIM6 configuration.
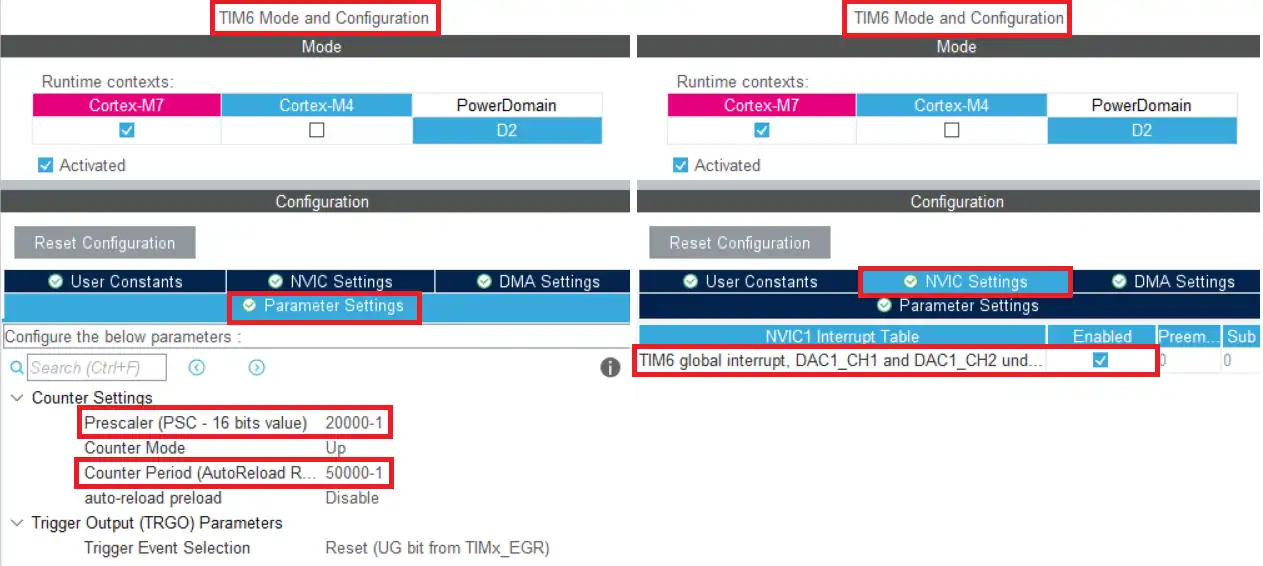
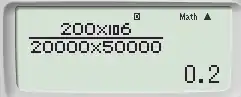
The TIM6 is connected to APB1 bus, which is running at 200Mhz. The Prescaler is set to 20000 and the ARR is set to 50000. With this configuration the Timer clock is running at 0.2hz and therefore an interrupt will generate every 5 seconds.
I2C Configuration for BME280
The I2C will be used to connect with the BME280 sensor module. I am using I2C4 and its configuration is shown in the image below.
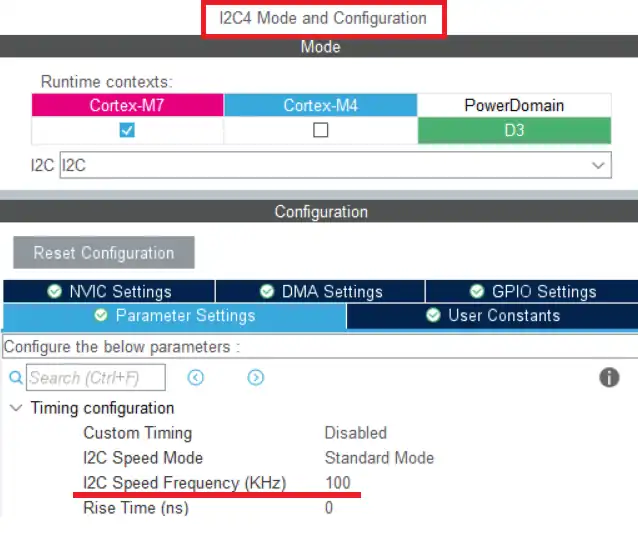
The I2C is configured in the default mode with the clock frequency set to 100Khz. Below is the image showing the connection between the device and the BME280.
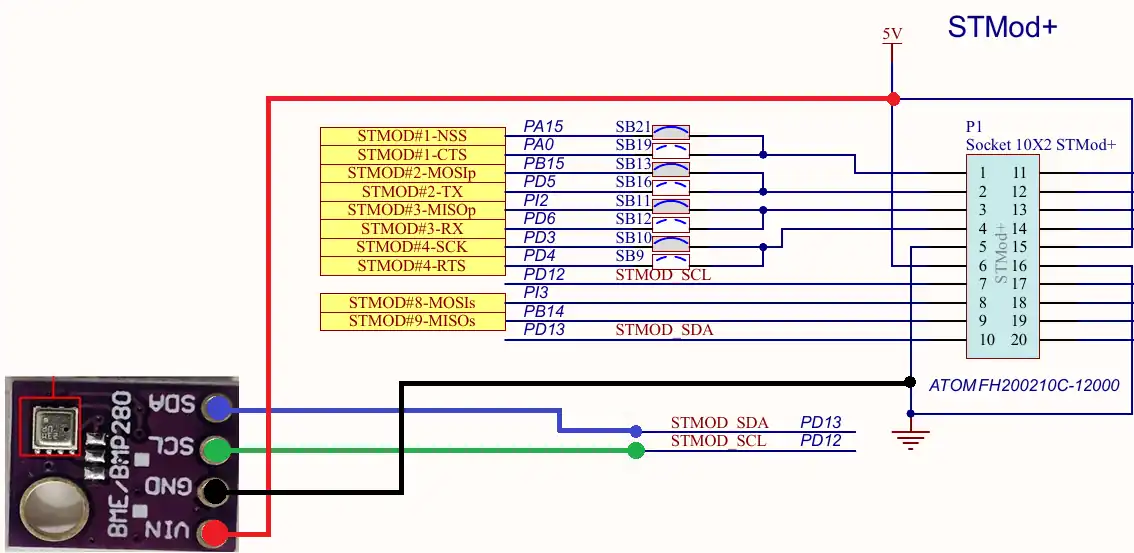
The connection is pretty simple. Connect the SCL to PD12 and SDA to PD13. The board is powered by 3.3V/5V.
Reading BME280 Data with STM32 Timer Interrupt
In this section, we will read the sensor data using a timer interrupt. We will sample the data every 5 seconds, store it, and calculate the hourly average.
We use TIM6 interrupt to trigger the measurement at fixed intervals.
Reading BME280 Data
Inside the timer callback, we first read the sensor values using the function
BME280_Measure();This function updates the global variables:
float Temperature, Humidity, Pressure;The pressure value is returned in Pascals. We convert it to kiloPascals.
Pressure = Pressure / 1000;Storing Data Every 5 Seconds
After reading the values, we store them in arrays.
temp_array[indx_5sec] = Temperature;
hum_array[indx_5sec] = Humidity;
press_array[indx_5sec++] = Pressure;We increment the index after storing the values. Since the timer runs every 5 seconds, we will store:
- 720 samples in 1 hour (3600 / 5)
Calculating hourly Average
Once we collect 1 hour of data, we calculate the average.
	if (indx_5sec == 720)  // 1 hr has passed
	{

		float sum_temp = 0;
		float sum_hum = 0;
		float sum_press = 0;

		// calculate the sum of all the recorded data in the array
		for (int i=0;i<720; i++)
		{
			sum_temp += temp_array[i];
			sum_hum += hum_array[i];
			sum_press += press_array[i];
		}

		// calculate average values
		avg_temp = (float)sum_temp/720;
		avg_hum = (float)sum_hum/720;
		avg_press = (float)sum_press/720;

		indx_5sec = 0;
		indx_1hr++;
		if (indx_1hr == 24) indx_1hr = 0;  // resets after 24 hrs
}These variables avg_temp, avg_hum and avg_press will later be passed to the getter function, so the Websocket can send them to the WebUI.
Complete Timer Callback Code
Below is the complete implementation combining all steps:
void HAL_TIM_PeriodElapsedCallback(TIM_HandleTypeDef *htim)
{
BME280_Measure();
Pressure = Pressure/1000; // change to KPa
	if (indx_5sec == 720)  // 1 hr has passed
	{

		float sum_temp = 0;
		float sum_hum = 0;
		float sum_press = 0;

		// calculate the sum of all the recorded data in the array
		for (int i=0;i<720; i++)
		{
			sum_temp += temp_array[i];
			sum_hum += hum_array[i];
			sum_press += press_array[i];
		}

		// calculate average values
		avg_temp = (float)sum_temp/720;
		avg_hum = (float)sum_hum/720;
		avg_press = (float)sum_press/720;

		indx_5sec = 0;
		indx_1hr++;
		if (indx_1hr == 24) indx_1hr = 0;  // resets after 24 hrs
	}
}STM32 Weather Station: Getter Functions & WebSocket Reporters
Now we will combine everything we covered so far and send the values to the gauges and graphs. Here we are using the same endpoint for both, so we just need to send the values once using the Websocket.
Defining the Getter Functions
First, we will define our custom getter functions for all three endpoints. These getter functions will be called by the WebUI when it wants to fetch the data for the end points.
void my_get_temp(struct temp *data)
{
data->value = avg_temp;
}
void my_get_hum(struct hum *data)
{
data->value = avg_hum;
}
void my_get_press(struct press *data)
{
data->value = avg_press;
}Here we will simply pass averaged temperature, pressure and humidity values to the data structure of the respective endpoint.
Registering the custom handlers
After defining the custom getter functions, we need to register them with the http handler. By default the WebUI will call the pre-generated getter functions, therefore, we need to register our functions signalling UI to call these instead.
mongoose_init();
mongoose_set_http_handlers("temp", my_get_temp, NULL);
mongoose_set_http_handlers("hum", my_get_hum, NULL);
mongoose_set_http_handlers("press", my_get_press, NULL);
for (;;) {
mongoose_poll();
}The second parameter of the function mongoose_set_http_handlers is NULL because we do not have any setter function. The WebUI will only read the data from STM32, it will not publish any data to it.
Adding the Websocket Reporters
Now we will add the Websocket Reporter functions. These function will be responsible for publishing the data to the gauges and graphs periodically.
mongoose_init();
mongoose_set_http_handlers("temp", my_get_temp, NULL);
mongoose_set_http_handlers("hum", my_get_hum, NULL);
mongoose_set_http_handlers("press", my_get_press, NULL);
mongoose_add_ws_reporter(30000, "temp");
mongoose_add_ws_reporter(30000, "hum");
mongoose_add_ws_reporter(30000, "press");
for (;;) {
mongoose_poll();
}The first parameter of mongoose_add_ws_reporter is the time interval in milliseconds.
In this case, the data will be published every 30000 ms (30 seconds).
The second parameter is the data field name. This must match the fields defined in the UI:
"temp"→ Temperature gauge"hum"→ Humidity gauge"press"→ Pressure gauge
The Main Function
Below is the modified art of the main function.
MX_I2C4_Init();
/* USER CODE BEGIN 2 */
HAL_TIM_Base_Start_IT(&htim6);
BME280_Config(OSRS_2, OSRS_16, OSRS_1, MODE_NORMAL, T_SB_0p5, IIR_16);
mongoose_init();
mongoose_set_http_handlers("temp", my_get_temp, NULL);
mongoose_set_http_handlers("hum", my_get_hum, NULL);
mongoose_set_http_handlers("press", my_get_press, NULL);
mongoose_add_ws_reporter(30000, "temp");
mongoose_add_ws_reporter(30000, "hum");
mongoose_add_ws_reporter(30000, "press");
for (;;) {
mongoose_poll();
}
/* USER CODE END 2 */Here we will start the TIM6 in the interrupt mode. When the timer period is elapsed, an interrupt will trigger and the PeriodElapsedcallback will be called. Inside this callback, we get the data from the sensor and calculate the average.
The function BME280_Config will configure the BME280 sensor. It is already explained in another tutorial, so I am not explaining here.
Complete Code
Here is the complete main.c with everything put together:
float Temperature=0, Humidity=0, Pressure=0;
float avg_temp = 0;
float avg_hum = 0;
float avg_press = 0;
volatile int temp_array[3600/5]; // every 5 sec for 1 hr
volatile int hum_array[3600/5]; // every 5 sec for 1 hr
volatile int press_array[3600/5]; // every 5 sec for 1 hr
volatile int indx_5sec = 0; // increments every 5 sec, resets every 5 min
volatile int indx_1hr = 0; // increments every 1 min, resets every hour
void HAL_TIM_PeriodElapsedCallback(TIM_HandleTypeDef *htim)
{
	BME280_Measure();
	Pressure = Pressure/1000;  // change to KPa
	if (indx_5sec == 720)  // 1 hr has passed
	{

		float sum_temp = 0;
		float sum_hum = 0;
		float sum_press = 0;

		// calculate the sum of all the recorded data in the array
		for (int i=0;i<720; i++)
		{
			sum_temp += temp_array[i];
			sum_hum += hum_array[i];
			sum_press += press_array[i];
		}

		// calculate average values
		avg_temp = (float)sum_temp/720;
		avg_hum = (float)sum_hum/720;
		avg_press = (float)sum_press/720;

		indx_5sec = 0;
		indx_1hr++;
		if (indx_1hr == 24) indx_1hr = 0;  // resets after 24 hrs
	}
}
void my_get_temp(struct temp *data)
{
	data->value = avg_temp;
}

void my_get_hum(struct hum *data)
{
	data->value = avg_hum;
}

void my_get_press(struct press *data)
{
	data->value = avg_press;
}
/*** Main Function ***/
int main(void) {
HAL_Init();
SystemClock_Config();
MX_GPIO_Init();
MX_ADC1_Init();
MX_TIM2_Init();
HAL_TIM_Base_Start_IT(&htim6);
BME280_Config(OSRS_2, OSRS_16, OSRS_1, MODE_NORMAL, T_SB_0p5, IIR_16);
  mongoose_init();
  mongoose_set_http_handlers("temp", my_get_temp, NULL);
  mongoose_set_http_handlers("hum", my_get_hum, NULL);
  mongoose_set_http_handlers("press", my_get_press, NULL);
  mongoose_add_ws_reporter(30000, "temp");
  mongoose_add_ws_reporter(30000, "hum");
  mongoose_add_ws_reporter(30000, "press");
  for (;;) {
    mongoose_poll();
  }
while (1){}
}STM32 Mongoose Weather Station: Live Dashboard Output
Now we will see the final output of the STM32 Ethernet weather station using Mongoose. The web interface displays both real-time values and historical data.
The image below shows the UI with data accumulated for over 10 hours.
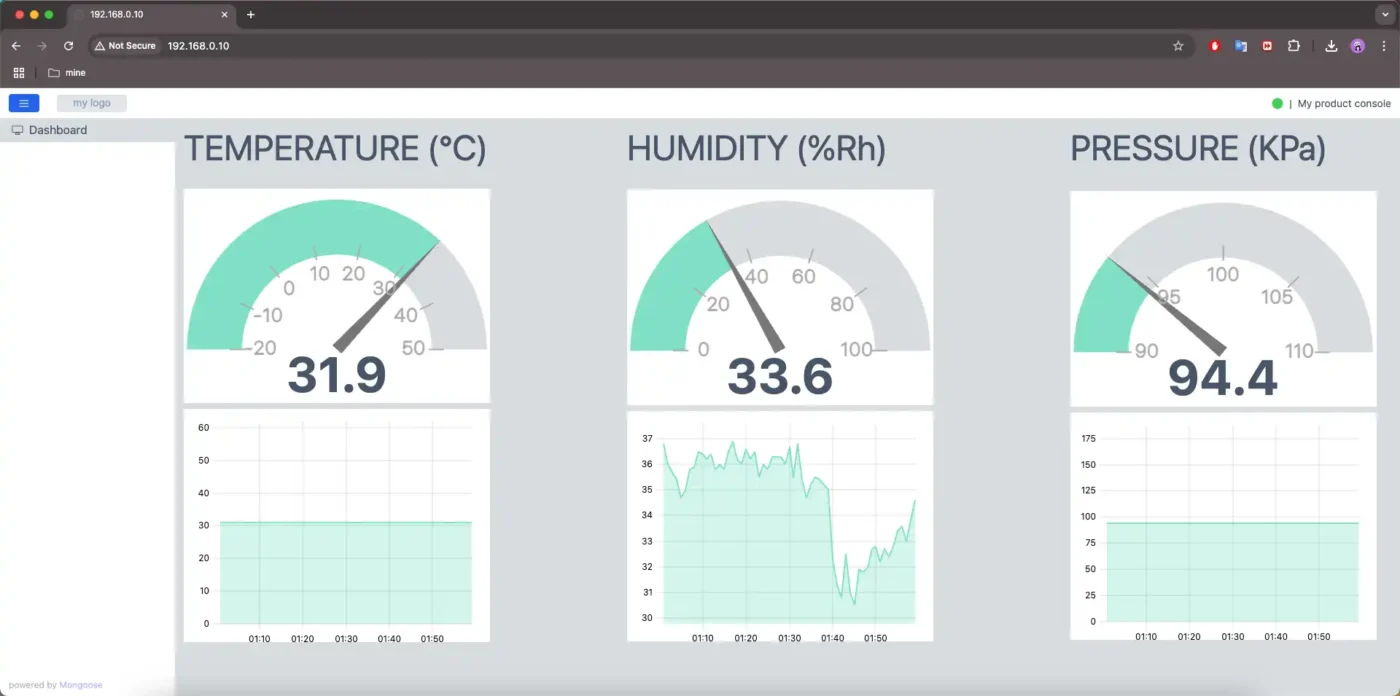
You can see the Gauges are showing the current readings, whereas the graph shows the data varied over a period of 10 hours.
STM32 Weather Station using Mongoose — Video Tutorial
Watch the complete walkthrough of this tutorial — building the web dashboard in Mongoose Wizard, configuring Ethernet, Timer and I2C in CubeMX, interfacing the BME280 sensor, implementing WebSocket for live gauge updates, creating REST APIs for graph data, and testing the STM32 weather station web server in a browser.
Download STM32 Weather Station with Mongoose Project Files
Complete CubeMX project for the STM32 Ethernet weather station, including BME280 sensor driver, Mongoose web UI with live gauges and 24-hour graphs, timer interrupt sampling, and WebSocket reporter setup. Free to download — support the work if it helped you.
STM32 Mongoose Weather Station — Frequently Asked Questions
Conclusion
In this tutorial, we built a complete STM32 Ethernet weather station using the Mongoose web server and the BME280 sensor. We designed the web dashboard in the Mongoose Wizard with gauges and graphs for temperature, humidity, and pressure, then configured the I2C peripheral for the BME280 and a TIM6 timer interrupt in CubeMX to sample sensor data every 5 seconds. On the code side, we wrote custom getter functions in main.c and registered WebSocket reporters to push live readings to the browser every 30 seconds — with the 24-hour graphs updating automatically using the same endpoints.
This kind of setup is directly applicable to real-world IoT monitoring. The entire system runs on the STM32 with no external server or cloud platform involved — just the board, the sensor, and an Ethernet cable. The structure is also easy to scale: adding a new sensor parameter is simply a matter of defining a new endpoint in the Mongoose Wizard and registering a getter and a WebSocket reporter in main.c.
In the next tutorial, we will look at OTA (Over-The-Air) firmware updates on the STM32 using Mongoose over Ethernet. This means flashing new firmware directly from a browser — no programmer or USB cable required. If you found this tutorial useful, stay tuned for that one.
Browse More STM32 Mongoose TCP/IP Tutorials

STM32 Web Server using Mongoose: HTTP, WebSocket & ADC Dashboard

STM32 OTA Firmware Update using Mongoose – Step by Step Guide
STM32 Real-Time Graph using Mongoose Ethernet

STM32 Fixed Memory Pool for Networking using Mongoose and O1heap
STM32 Mongoose with W5500 – Ethernet on Any STM32 MCU

STM32 Modbus TCP Server – Read Input Registers with Mongoose

STM32 Modbus TCP Server – Read Discrete Inputs with Mongoose

Subscribe
Login
0 Comments
Newest
