
Home ▸ STM32 Tutorials ▸
Implement Weather Station on STM32 using Mongoose
In this tutorial you will learn how to create a weather station using STM32 and the Mongoose library, read sensor data and serve it over Ethernet via a dynamic web interface. The project is available to download at the end of the post.

Recommended Resources:
This tutorial is a part of the STM32 Ethernet tutorial series. This is also the 3rd tutorial in the mini series covering the implementation of the Mongoose Networking Library. The Previous tutorials in this mini series covered how to set up the Mongoose library on STM32 and how to run a webserver on STM32 using this library.
You should take a look at the following tutorials before continuing here:
- STM32 Ethernet with Mongoose | Part 1 Setup Guide
- STM32 Ethernet with Mongoose | Part 2 Web Server
- Interfacing BME280 Sensor with STM32 (I2C)
VIDEO TUTORIAL
You can check the video to see the complete explanation and working of this project.
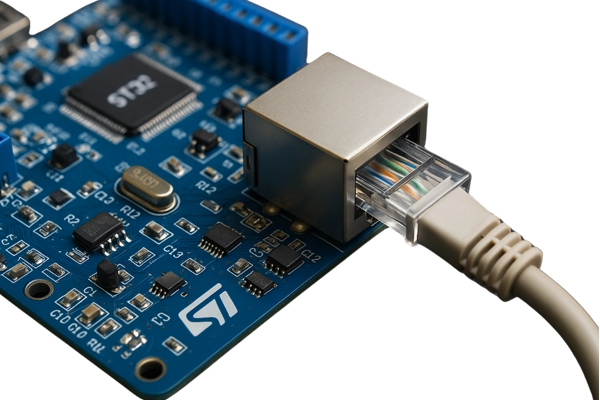
Introducing STM32 Ethernet Peripheral
STM32 microcontrollers with built-in Ethernet MAC (Media Access Controller) enable high-speed wired communication, making them ideal for IoT, industrial automation, and real-time data transfer applications. By integrating Ethernet directly into the MCU, STM32 devices reduce the need for external network controllers, simplifying hardware design and reducing cost.
Below are some important features of STM32 Ethernet:
- Integrated Ethernet MAC: Many STM32 MCUs (like STM32F7 and STM32H7 series) come with a built-in Ethernet MAC controller.
- 10/100 Mbps Support: Compatible with both 10 Mbps and 100 Mbps Ethernet networks.
- RMII/MII Interface: Supports Reduced Media Independent Interface (RMII) and Media Independent Interface (MII) for PHY connection.
- TCP/IP Stack Support: Can work with lightweight stacks like LwIP or full-featured libraries like Mongoose.
- Real-Time Communication: Suitable for deterministic data transfer in real-time applications.
- Low Power Consumption: Optimized for embedded systems with power-saving modes.
Introducing Mongoose Networking Library
Mongoose is a lightweight, embeddable networking library designed for real-time, embedded, and IoT applications. It provides an easy way to implement networking features such as TCP/IP, HTTP, WebSocket, MQTT, and more, making it a powerful tool for creating connected devices.
Below are some important features of the Mongoose:
- Embedded Web Server: Serve web pages and REST APIs directly from your device.
- Built-in Protocols: Supports HTTP, WebSocket, MQTT, and more.
- TLS/SSL Support: Secure communication using mbedTLS or OpenSSL.
- Lightweight & Portable: Minimal footprint, runs on STM32, ESP32, and many platforms.
CREATE WEB UI
I have already explained how to create the WebUI In the previous tutorial, So I will skip explaining every detail here. Let’s just focus on some new information.
Below is the Final WebUI.
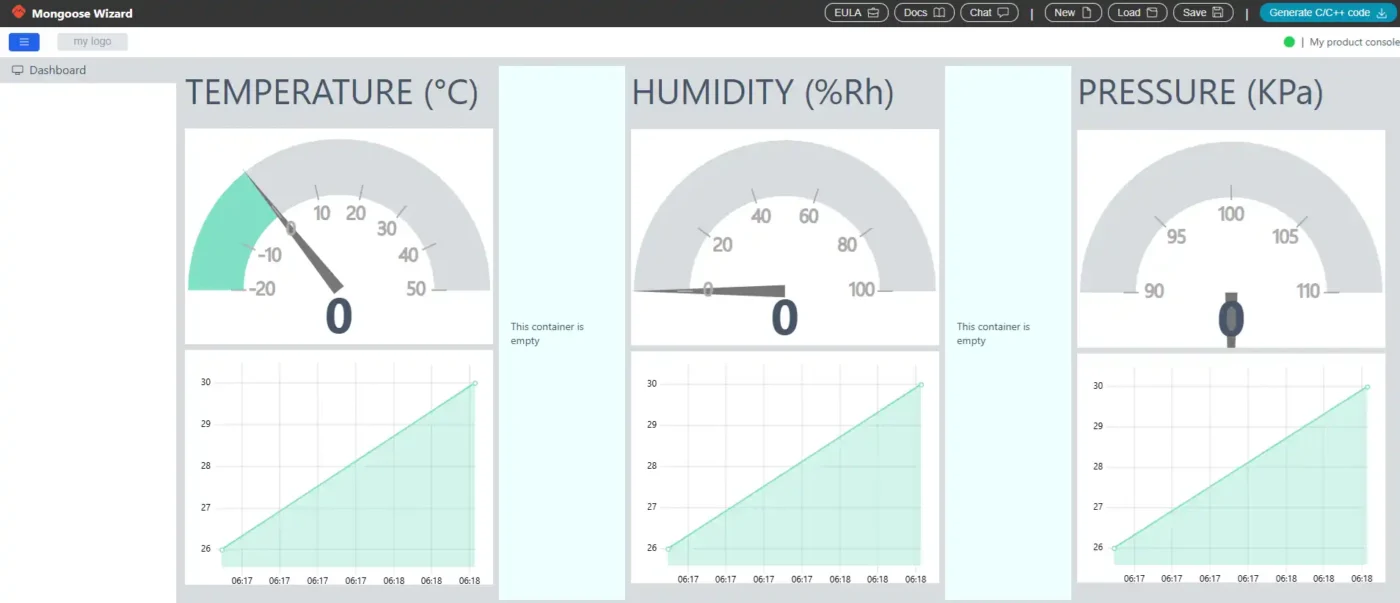
I have create 3 Gauges to show the current Temperature, Humidity and Pressure values. There are 3 Graphs to display the data for these variables over a period of time.
Gauge Configuration
Below is image showing the configuration for the Temperature Gauge.
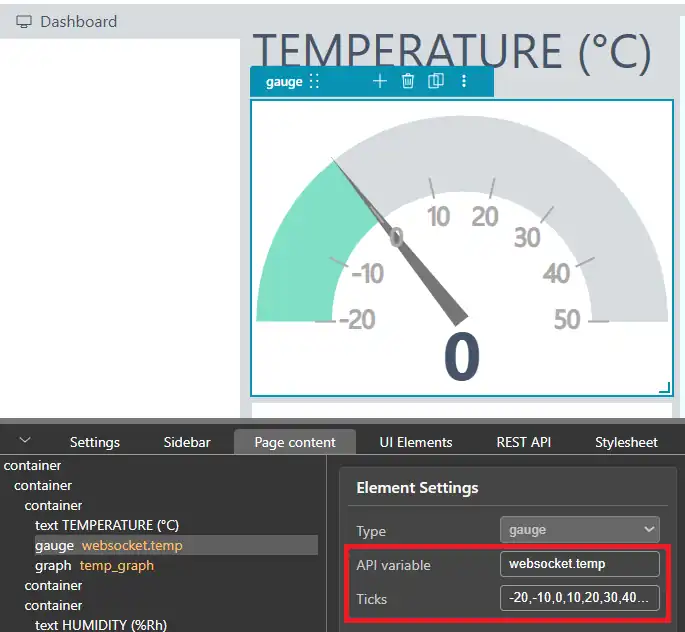
I am going to use the websocket to update the gauge data. “temp” is the Data field assigned to the temperature gauge. I have also defined the Ticks to provide a possible range for the temperature readings on the gauge.
Similar configuration is made for the Humidity and Pressure Gauges as well. “hum” and “pressure” are the data fields assigned to the Humidity and Pressure gauges respectively.
Graph Configuration
Below is image showing the configuration for the Temperature Graph.
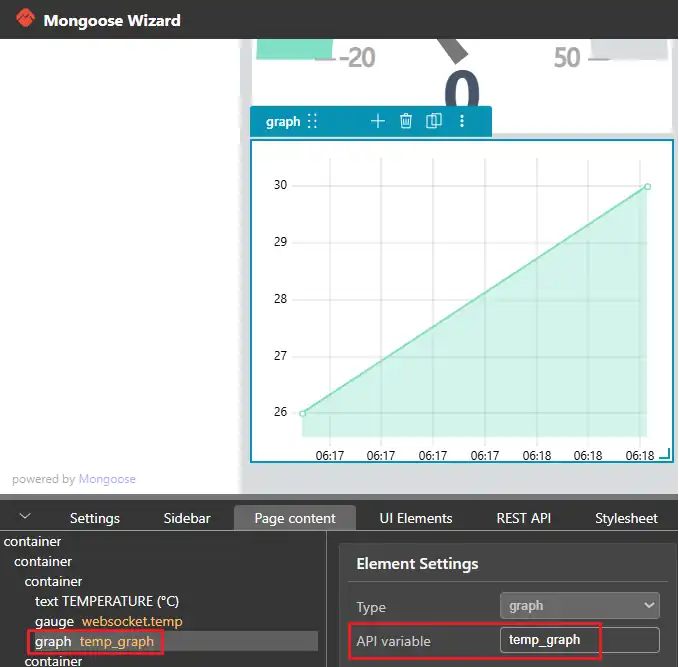
“temp_graph” is the API Endpoint for the Temperature Graph. The REST API is shown in the image below.
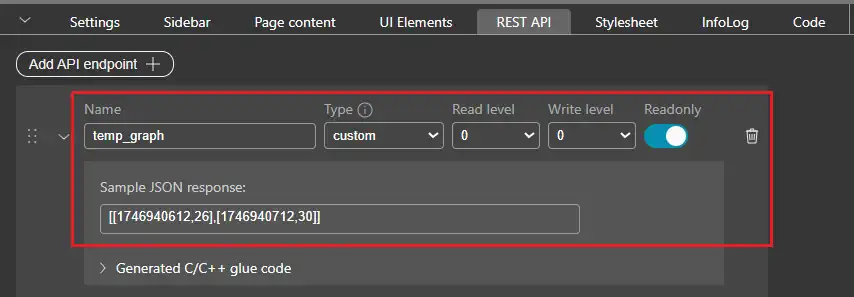
“temp_graph” is a custom Data type. Here we need to send a JSON response to display it on the graph. Since we are displaying Temperature data over time, the response should be in the format [[Time1,Temp1],[Time2,Temp2],[Time3,Temp3]…].
For testing, you can get the Timestamp from https://www.epochconverter.com/.
Similar configuration is made for the Humidity and Pressure Graphs as well. “hum_graph” and “pressure_graph” are the API Endpoints assigned to the Humidity and Pressure graphs respectively.
General Setting
Below is the image showing the configuration for the Setting page of the dashboard.
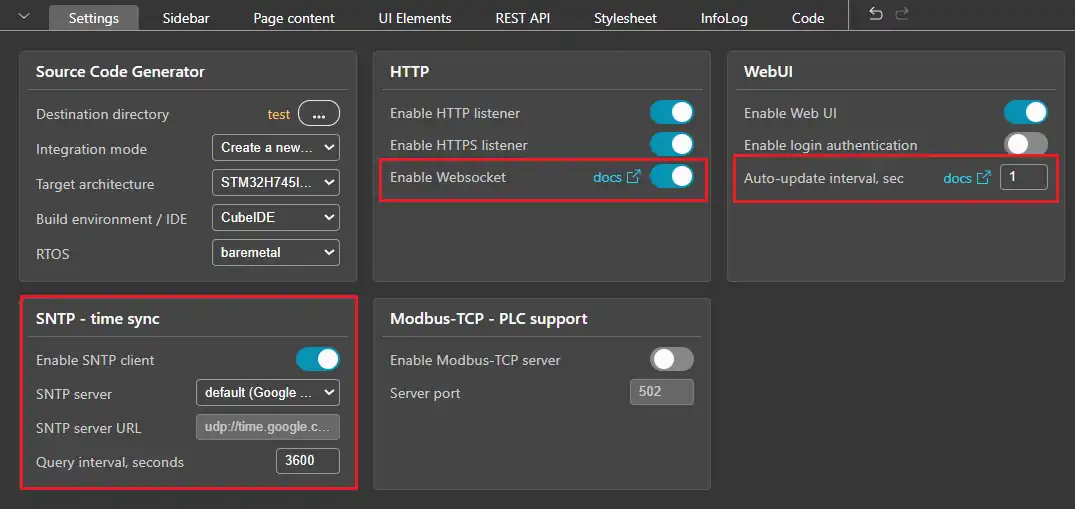
As mentioned earlier, I am going to use the websocket to update the gauge data. Therefore the Websocket it Enabled here in the Setting.
The Auto-update interval should be set higher than 1. We will use the heartbeat API to refresh the entire page every hour. This is necessary to update the graph data.
SNTP is also Enabled. This is needed by the mongoose to sync the time with the google server. We need the time data for the timestamp, which is used by the graphs. Note that the device must have an internet connection for the SNTP to work. Basically you must connect the device to a router instead of directly connecting it to the computer.
CONFIGURE CUBEMX
Timer Configuration
We will use the Timer to generate an interrupt every 5 seconds. This interrupt will be then used to measure the temperature, humidity and pressure data from the sensor. Below is the image showing the TIM6 configuration.
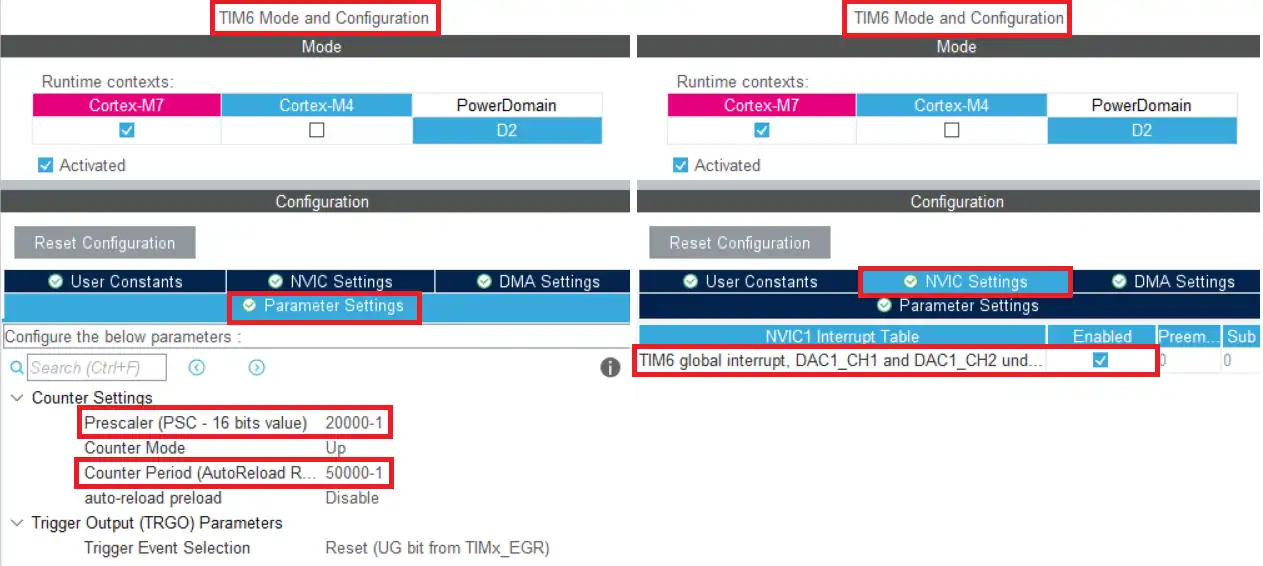
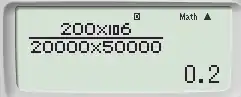
The TIM6 is connected to APB1 bus, which is running at 200Mhz. The Prescaler is set to 20000 and the ARR is set to 50000. With this configuration the Timer clock is running at 0.2hz and therefore an interrupt will generate every 5 seconds.
I2C Configuration
The I2C will be used to connect with the BME280 sensor module. I am using I2C4 and its configuration is shown in the image below.
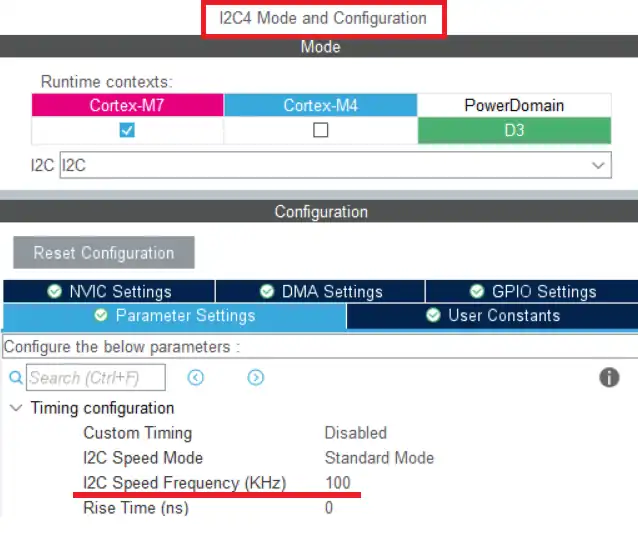
The I2C is configured in the default mode with the clock frequency set to 100Khz.
Below is the image showing the connection between the device and the BME280.
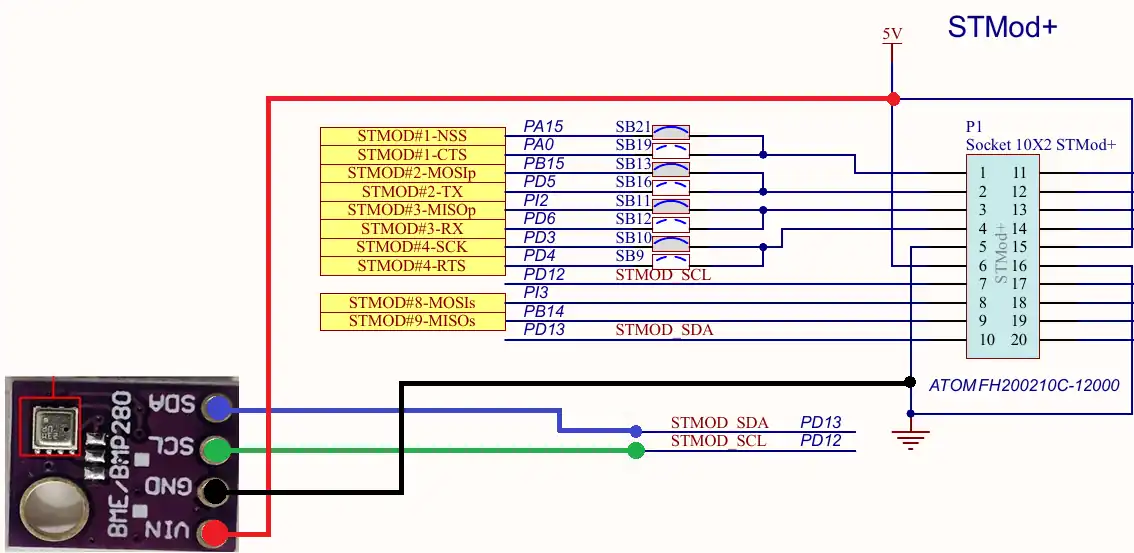
The connection is pretty simple. Connect the SCL to PD12 and SDA to PD13. The board is powered by 3.3V/5V.
THE CODE
Definitions
Below are some variables and arrays that we will use in the project.
float Temperature=0, Humidity=0, Pressure=0;
volatile int temp_array[3600/5];  // every 5 sec for 1 hr
volatile int hum_array[3600/5];  // every 5 sec for 1hr
volatile int pressure_array[3600/5];  // every 5 sec for 1 hr
volatile float TEMP_ARRAY[24][2];  // data for 1 day
volatile float HUM_ARRAY[24][2];  // data for 1 day
volatile float PRESSURE_ARRAY[24][2];  // data for 1 day
volatile int indx_5sec = 0;  // increments every 5 sec, resets every 1 hr
volatile int indx_1hr = 0;  // increments every 1 hr, resets every day
volatile int indx_graph = 0; // increments every 1 hr, stops at max (23 for 1 day)The variables Temperature, Humidity and Pressure will update after reading their values from the BME280 Sensor.
The temp_array, hum_array and pressure_array will be used for storing the respective parameter every 5 seconds. These arrays can store 720 values, basically the data for an hour.
TEMP_ARRAY, HUM_ARRAY and PRESSURE_ARRAY are the matrices with 24 rows and 2 columns. The 1st column will store the timestamp whereas the 2nd column will be used to store the average of an hour’s data. These matrices can store 24 values, basically the data for an entire day.
The variable indx_5sec will increment every 5 seconds. It will be used for storing the data into the arrays. It will reset every hour, so that the new can can store from the beginning of the array.
The variable indx_1hr will increment every hour. It will be used for storing the data into the matrices. It will reset every day so that the new can can store from the beginning of the matrix.
The variable indx_graph will also increment every hour. It will be used by the graph functions to display the data. When this variable will reach the maximum value (23 in this case), it will remain at it. This way, we will always have a record of 24 values for the graph.
The Timer Callback
The TIM6 callback is called every 5 Seconds. It will be used for measuring the data from the device, along with storing the data into the arrays. Below is the implementation of the Timer callback.
void HAL_TIM_PeriodElapsedCallback(TIM_HandleTypeDef *htim)
{
	BME280_Measure();
Pressure = Pressure/1000; // change to KPaHere we will first call the BME280 function to measure all 3 parameters. The Pressure value returned in the Pascals, therefore I am concerting it to KiloPascals by dividing it by 1000.
Then we will store the Temperature, Humidity and Pressure data into the arrays.
	temp_array[indx_5sec] = Temperature;
	hum_array[indx_5sec] = Humidity;
pressure_array[indx_5sec++] = Pressure;The variable indx_5sec will increment after storing the value in the last array. This way the next readings will be stored at the next position in the array.
Next we will wait for one hour of data to be accumulated in the arrays. Once done, we will take the average of the accumulated data.
	if (indx_5sec == 720)  // 1 hour is passed
	{
		float sum_temp = 0;
		float sum_hum = 0;
		float sum_pressure = 0;

		// calculate the sum of all the recorded data in the array
		for (int i=0;i<720; i++)
		{
			sum_temp += temp_array[i];
			sum_hum += hum_array[i];
			sum_pressure += pressure_array[i];
		}

		// calculate average values
		float avg_temp = (float)sum_temp/720;
		float avg_hum = (float)sum_hum/720;
float avg_pressure = (float)sum_pressure/720;The variable indx_5sec increments every 5 Seconds. Therefore we will wait for the variable to reach the value 720 (720×5 = 3600). Now we have the average of the Temperature, Humidity, and Pressure values for every hour.
We will store this averaged data into the Matrix we defined above.
		TEMP_ARRAY[indx_1hr][0] = (mg_now()/1000);  // store the timestamp
		TEMP_ARRAY[indx_1hr][1] = avg_temp;  // store the average value
		HUM_ARRAY[indx_1hr][0] = (mg_now()/1000);
		HUM_ARRAY[indx_1hr][1] = avg_hum;
		PRESSURE_ARRAY[indx_1hr][0] = (mg_now()/1000);
PRESSURE_ARRAY[indx_1hr][1] = avg_pressure;The 1st Column of the matrix will store the Timestamp. The function mg_now() returns the Timestamp if the device has access to the internet. Otherwise this function will return the Time since boot in milliseconds.
The 2nd Column of the matrix will store the average value of the Temperature, Humidity and Pressure data of an hour.
Once all the storing is done, we will reset the variables.
		indx_5sec = 0;
		indx_1hr++;
		indx_graph++;
		if (indx_1hr == 24) indx_1hr = 0;  // resets after 24 hours
		if (indx_graph>=24-1) indx_graph = 24-1;  // will keep the value 23, so the graphs can display the data for 24 hours
	}
}Here we will reset the variable indx_5sec, so that the storing can start from the beginning of the array. The variable indx_1hr will increment every hour. This variable will reset once every 24 hours, so the storing can again start from the beginning of the matrix.
The variable indx_graph will also increment. This variable will be used by the graph functions to display the data on the graph. This variable will remain constant after reaching the MAX value (23 in this case).
Updating Gauges
We will use the websocket API to update the Gauges on the UI. Below is the implementation of the websocket related functions.
Inside the main function we will call the function mongoose_add_ws_handler to add the websocket handler (my_wsHandler) to run every 5000ms.
mongoose_add_ws_handler(5000, my_wsHandler);The websocket callback (my_wsHandler) is defined outside the main function. Inside the websocket callback (my_wsHandler) we will call the function mg_ws_printf to send the websocket structure to the UI. The websocket message structure is shown below.
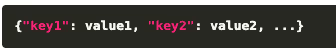
Here “key1” is the member of the websocket structure and value1 is the value of this member.
static void my_wsHandler(struct mg_connection *c) {
  mg_ws_printf(c, WEBSOCKET_OP_TEXT, "{\"temp\": %.01f, \"hum\": %.01f, \"pressure\": %.01f}", (double)Temperature, (double)Humidity, (double)Pressure);
}In the callback function, we will use the websocket message structure {\”temp\”: %.01f, \”hum\”: %.01f, \”pressure\”: %.01f}. Here temp, hum and pressure are the members of the websocket structure we defined in the UI and %.01f is the value of these members, which are fetched from the Temperature, Humidity and Pressure variables.
Updating Graphs
The graph related functions are generated in the mongoose_glue.c file. Therefore we will write our code in this file itself.
size_t temp_data(void (*out)(char, void *), void *ptr, va_list *ap) {
	  size_t len = 0;
	  for (int i=0; i<indx_graph; i++)
	  {
		  if (i==0) len += mg_xprintf(out, ptr, "[%f,%.01f]", (double)TEMP_ARRAY[i][0], (double)TEMP_ARRAY[i][1]);
		  else len += mg_xprintf(out, ptr, ",[%f,%.01f]", (double)TEMP_ARRAY[i][0], (double)TEMP_ARRAY[i][1]);
	  }
	  return len;
}The function temp_data will be used to convert the data stored in the Temperature Matrix (TEMP_ARRAY) to the JSON format required by the graph.
After converting the data, we will call the generated function to send the data to the graph.
void glue_reply_temp_graph(struct mg_connection *c, struct mg_http_message *hm) {
  const char *headers = "Cache-Control: no-cache\r\n" "Content-Type: application/json\r\n";
  mg_http_reply(c, 200, headers, "[%M]\n", temp_data, hm);
}Similar functions are defined for Humidity and Pressure graphs as well.
The updated data can only be displayed when the UI is refreshed. We can use the Heartbeat API to refresh the UI every hour. Below is the implementation of Heartbeat to refresh the UI.
First of all we need to create a soft timer to run every hour. We can create it in the mongoose_glue.h file, after initializing the mongoose library.
mg_timer_add(&g_mgr, 60*60*1000,MG_TIMER_REPEAT,autoupdate_timer, NULL);This timer will call the function autoupdate_timer every hour. We will write this function in the main file, where we will call another function glue_update_state() to update the entire screen.
static void autoupdate_timer(void *arg) {
  glue_update_state();  // this increments the heartbeat counter
  (void) arg;
}The main function
Below is the modified part of the main function. Basically our code will be written between the /* USER CODE 2 */.
  /* USER CODE BEGIN 2 */
  HAL_TIM_Base_Start_IT(&htim6);
  mongoose_add_ws_handler(5000, my_wsHandler);
  BME280_Config(OSRS_2, OSRS_16, OSRS_1, MODE_NORMAL, T_SB_0p5, IIR_16);
  run_mongoose();
/* USER CODE END 2 */Here we will start the TIM6 in the interrupt mode. When the timer period is elapsed, an interrupt will trigger and the PeriodElapsedcallback will be called.
The function mongoose_add_ws_handler will add the websocket handler (my_wsHandler) to run every 5000ms.
The function BME280_Config will configure the BME280 sensor. It is already explained in another tutorial, so I am not explaining here.
Finally the function run_mongoose will run the mongoose library.
RESULT
Below is the image showing the UI with data accumulated for over 10 hours.
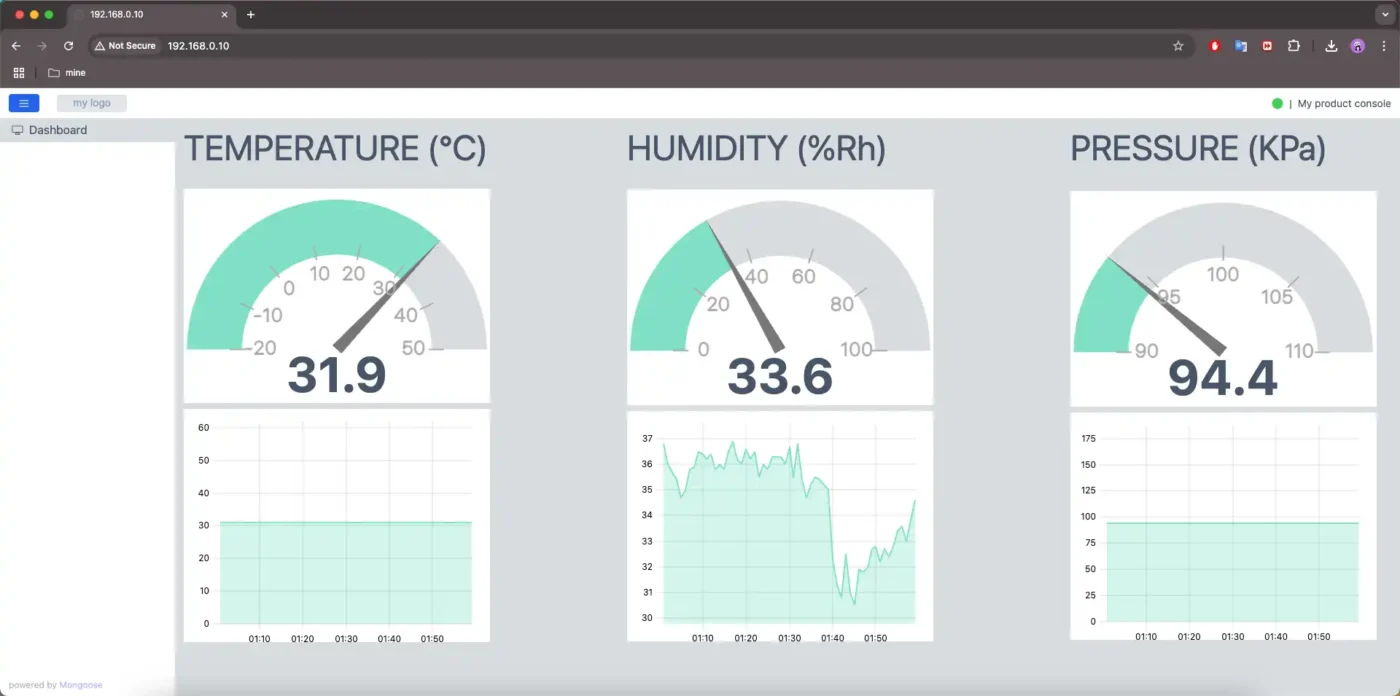
You can see the Gauges are showing the current readings, whereas the graph shows the data varied over a period of time.
STM32 Mongoose Ethernet Tutorial Series


PROJECT DOWNLOAD
Subscribe
Login
0 Comments
Newest